
Grid Parity: Definition, Current Status, Cost Inputs, Calculation, Subsidies, Sunlight, Types, Limits, Drivers
Grid parity is the point where electricity from solar panels costs the same as electricity bought from the utility grid. Key aspects include current status, definition, calculation, cost inputs, sunlight, subsidies, limits, types, and drivers. It is usually measured by comparing the levelized cost of solar energy, which spreads all costs over the electricity a system produces, with the retail or wholesale price of grid power. You will see that cost inputs such as panel prices, installation labor, financing, incentives and maintenance all shift the result. Sunlight matters just as much, because a system in a sunnier place produces more kilowatt-hours from the same equipment and lowers the cost of each one. Electricity rates also vary by region, which is why solar power in Pennsylvania reaches parity under different conditions than a desert state with stronger sun. The sections below explain the calculation, the inputs behind it, the effect of sunlight and the current status of parity.
Key Takeaways
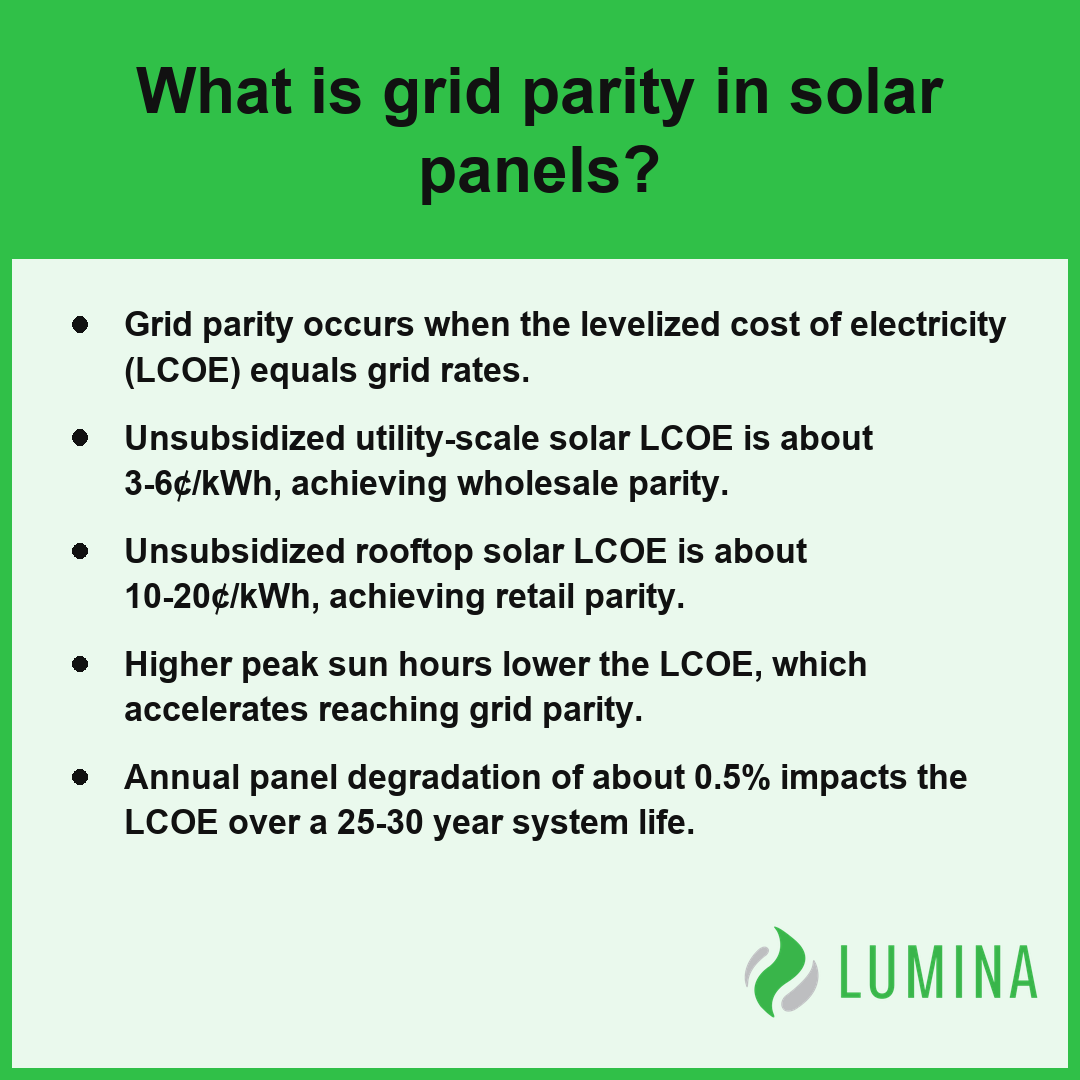
- Grid parity occurs when the levelized cost of electricity (LCOE) equals grid rates.
- Unsubsidized utility-scale solar LCOE is about 3-6¢/kWh, achieving wholesale parity.
- Unsubsidized rooftop solar LCOE is about 10-20¢/kWh, achieving retail parity.
- Higher peak sun hours lower the LCOE, which accelerates reaching grid parity.
- Annual panel degradation of about 0.5% impacts the LCOE over a 25-30 year system life.
What Is Grid Parity in Solar Panels?
Grid parity in solar panels is the point at which the levelized cost of electricity (LCOE) produced by your system becomes equal to the price you would otherwise pay for electricity from the utility grid, measured in cents per kilowatt-hour (¢/kWh). When you achieve this milestone, the power generated by your rooftop solar is no longer more expensive than the electricity delivered by your local provider.
| Comparison Metric | Retail Parity Context | Wholesale Parity Context |
|---|---|---|
| Primary Comparison Target | Monthly residential utility bill | Open market power purchase prices |
| Included Cost Components | Generation, transmission, and delivery fees | Raw generation costs only |
| Competitive Benchmark | Consumer retail rate | Gas and coal generation costs |
| Primary Driver for Success | Local net metering policies | Utility-scale infrastructure efficiency |
Solar Module Price Decline (2010–2025)
This comparison typically splits into two distinct categories depending on your connection to the grid:
- Retail parity: Occurs when your rooftop solar LCOE matches the price you pay for power on your monthly utility bill, including all transmission and delivery fees.
- Wholesale parity: Occurs when the LCOE of utility-scale solar matches the price utilities pay to purchase power on the open market or the cost of competing generation sources like gas or coal.
Because retail rates often include significant overhead costs for infrastructure maintenance and grid operations, reaching retail parity is generally more achievable for an individual household than reaching wholesale parity. According to the National Renewable Energy Laboratory, the achievement of grid parity for solar photovoltaics is largely determined by regional factors, such as local solar irradiance, utility rate structures, and state-level net metering policies. The dramatic decline in solar module prices, which fell by roughly 90% or more between 2010 and the mid-2020s, has been the primary driver in pushing more systems toward this equilibrium. Compare your most recent utility bill’s cost per kilowatt-hour against the estimated LCOE of a potential system to determine if your household is currently positioned to benefit from this economic shift.
Achieving grid parity depends on several site-specific variables that impact your individual LCOE calculation:- Local solar irradiance levels, which dictate the total kilowatt-hours produced annually by your system.
- Existing utility rate structures, including time-of-use pricing and fixed monthly grid connection charges.
- Availability of regional financial incentives, such as federal tax credits, state rebates, or solar renewable energy certificates (SRECs).
- System installation soft costs, including permitting, inspection fees, and labor rates in your specific jurisdiction.
How Do You Calculate Grid Parity for Solar Using Levelized Cost of Electricity (LCOE)?
To calculate grid parity for solar, you must determine the levelized cost of electricity (LCOE) by dividing the total lifetime costs of your rooftop solar installation by the total amount of electricity in kilowatt-hours it is expected to generate, then compare that figure against the retail or wholesale rate you pay for energy. Because grid parity represents the point where your self-generated solar electricity matches the price of drawing from the public network, understanding how your specific costs distribute over the system life is essential for a accurate evaluation.
| LCOE Variable | Definition/Impact | Standard Metric for Calculation |
|---|---|---|
| Installed Cost | Total upfront capital expenditure (equipment, labor, permits) | $2.50 – $3.50 per Watt |
| System Longevity | Projected operational duration for energy output | 25 – 30 Years |
| Efficiency Loss | Annual panel degradation factor | 0.5% per Year |
| Geography Factor | Irradiance capacity based on local sunlight | Peak Sun Hours |
| Capital Valuation | Adjustment for the time value of money | Discount Rate |
| Grid Parity Target | Benchmark for retail/wholesale cost comparison | Total ¢/kWh (including fees) |
Estimated Residential Solar Costs ($/Watt)
- Installed Cost per Watt: Total expenditures for equipment, labor, and permitting, typically ranging from $2.50 to $3.50 per watt for a residential system.
- System Life: The expected duration of operation, standardly set at 25-30 years for LCOE projections.
- Panel Degradation: A factor accounting for the typical reduction in efficiency over time, calculated at about 0.5% per year.
- Peak Sun Hours: The measure of solar irradiance in your specific geography, which directly dictates total lifetime kilowatt-hour production.
- Discount Rate: An adjustment factor used to account for the time value of money when comparing current capital outlays to future energy savings.
Analyze your most recent electricity statement to isolate the specific cents per kilowatt-hour (¢/kWh) rate you pay, including all delivery and transmission fees, to ensure your LCOE comparison reflects the true cost of utility-provided power. Per the U.S. Energy Information Administration, determining grid parity involves comparing your solar LCOE against the total retail rate, which serves as an approximation that accounts for the combined generation, transmission, and distribution costs passed on to the consumer.
To optimize your LCOE calculation for accuracy, consider these additional operational and financial variables:- Account for recurring maintenance expenses, such as inverter replacements, which typically occur between years 12 and 15.
- Incorporate local utility rate escalation, as grid-purchased electricity prices generally rise over time, unlike fixed-cost solar generation.
- Apply relevant federal, state, or municipal tax credits to your total capital expenditure to reduce the initial investment basis.
- Factor in potential performance monitoring costs or service agreements that ensure the system maintains its rated output capacity.
How Installed Cost per Watt, System Life, and Panel Degradation Affect Grid Parity
How installed cost per watt, system life, and panel degradation affect grid parity is determined by their direct influence on the levelized cost of electricity (LCOE), which establishes the baseline for reaching grid parity. Because the LCOE calculation aggregates all lifetime expenditures against the total energy output, every change in equipment efficiency or financial commitment shifts the timeline for achieving retail parity or wholesale parity.
| Metric | Baseline Value | Impact on LCOE | Grid Parity Sensitivity |
|---|---|---|---|
| Installed Cost/Watt | $2.50 – $3.50 | High (Direct CapEx reduction) | Primary driver of acceleration |
| System Lifespan | 25 – 30 Years | Medium (Amortization period) | Dilutes upfront capital intensity |
| Panel Degradation | 0.5% Annual | Low to Moderate (Output variance) | Forces LCOE upward over time |
Solar Financial and Performance Metrics
- Installed Cost per Watt: With residential costs currently averaging $2.50-$3.50 per watt, this represents the most significant barrier to grid parity; lower upfront capital expenditures immediately reduce the LCOE by lowering the total investment needed for each kilowatt-hour produced. According to Lawrence Berkeley National Laboratory, total installed costs per watt in the United States have historically trended downward because of improved balance-of-system components and more efficient labor practices, a trend that directly accelerates the timeline for solar to reach retail grid parity.
- System Life: A projected lifespan of 25-30 years allows you to amortize high initial costs over a longer duration, effectively diluting the expense of the system and making it easier for solar to compete with grid rates.
- Panel Degradation: With a typical rate of about 0.5% per year, panel degradation reduces the total energy yield over time, which forces the LCOE upward; if your panels lose efficiency faster than expected, the system may take longer to reach grid parity.
Analyze the warranty terms regarding performance guarantees to ensure your long-term energy projections account for the total output lost to expected annual degradation.
Secondary factors beyond initial hardware costs significantly influence the long-term economic viability of solar installations:- Financing Costs: Interest rates on solar loans directly amplify the total cost of ownership, often outweighing minor gains in panel efficiency.
- Operation and Maintenance (O&M): Periodic inverter replacements and cleaning schedules impact the actualized energy yield over the system’s lifespan.
- Utility Rate Structures: Changes in net metering policies or time-of-use billing can shorten the payback period regardless of hardware performance.
- Tax Incentives and Rebates: Federal investment tax credits and local subsidies artificially deflate the net capital expenditure, effectively accelerating grid parity.
Has Solar Reached Grid Parity Yet, and Which States Got There First?
You have reached grid parity when the levelized cost of electricity (LCOE) for your rooftop solar system matches your local utility rates, a milestone first achieved in states with high retail electricity prices and strong net metering policies where the unsubsidized residential rooftop solar LCOE of 10-20¢/kWh competes with typical grid prices of 16-18¢/kWh.
| Energy Segment | Cost / Rate Status | Estimated Rate (¢/kWh) | Parity Standing |
|---|---|---|---|
| Utility-Scale Solar | Generation Cost | 4.5 | Surpasses Wholesale Markets |
| Low-Rate Regional Grid | Retail Price | 12.0 | Pre-Parity |
| National Average Grid | Retail Price | 17.0 | Competitive Threshold |
| Rooftop Solar | Levelized Cost (LCOE) | 15.0 | Achieved (High-Rate Areas) |
| High-Rate Regional Grid | Retail Price | 35.0 | Strong Parity |
LCOE by Energy Source (¢/kWh)
Where Retail Parity Arrived First
Yes, solar has reached grid parity in many regions, with retail parity first arriving in areas where high electricity rates met abundant sunlight. Because retail parity occurs when the levelized cost of electricity (LCOE) matches the total rate paid by a customer—which includes grid delivery and transmission fees—it is often achieved faster in markets where residential utility rates are significantly higher than the national average.
- High-rate regions: Retail parity reached in coastal and island areas where rates reach 30-40¢/kWh.
- Lower-rate regions: Parity remains elusive in areas where rates are 11-13¢/kWh.
- Global progress: Solar module price declines of roughly 90% or more since 2010 catalyzed this transition.
Why Wholesale Parity Is Further Along for Utility-Scale Solar
Wholesale parity is further along for utility-scale solar because its LCOE is significantly lower, typically falling between 3-6¢/kWh unsubsidized. Per the Energy Information Administration, solar photovoltaic electricity generation has effectively reached grid parity across the United States when comparing the levelized cost of energy for utility-scale solar against the costs of conventional fossil fuel generation. This competitive advantage allows utility-scale solar to directly displace traditional coal or gas generation on the wholesale market. Since these projects benefit from economies of scale and optimized installation costs, they have successfully cleared the hurdle of grid parity across most of the country.
What Changes the Picture for Rooftop Solar?
For rooftop solar, reaching grid parity is more complex because it must compete with residential retail rates rather than wholesale costs. The financial viability of your system often depends on specific incentives and local energy policies that alter the net value of your generation.
Net Metering and Federal Tax Credit Effects
Net metering allows you to receive credits for excess energy pushed to the grid, while the federal tax credit lowers your upfront capital requirements. These mechanisms significantly reduce your effective LCOE, often shortening the typical residential solar payback period to 7-12 years.
Calculate your specific utility bill average against the unsubsidized residential rooftop solar LCOE range of 10-20¢/kWh to determine your current distance from retail parity.
Several factors accelerate the timeline for achieving residential solar grid parity:- Time-of-Use (TOU) Pricing: Utilities charging higher rates during peak daylight hours effectively raise the value of solar generation, helping homeowners reach parity faster.
- Solar Renewable Energy Certificates (SRECs): Performance-based incentives allow system owners to sell credits for generated electricity, further lowering the effective LCOE.
- Federal Investment Tax Credit (ITC): Tax offsets significantly reduce the upfront capital expenditure of an installation, directly lowering the long-term cost per kilowatt-hour.
- State-Level Rebates: Local financial incentives and cash-back programs shorten the system payback period in specific jurisdictions.
Does the Number of Peak Sun Hours in Your Area Change When Solar Reaches Grid Parity?
Yes, the number of peak sun hours in your area directly influences when you reach grid parity by acting as a multiplier for your total electricity production. Because your levelized cost of electricity (LCOE) is determined by dividing total system costs by the lifetime energy generated, a location that receives 5.5 peak sun hours per day will inherently lower its LCOE compared to a location receiving only 3.5. When your daily energy yield is higher, your system produces more ¢/kWh over its 25-30 year lifespan, which effectively accelerates the timeframe in which your solar output matches or beats the local utility rate. Per the Department of Energy, these variations in peak sun hours significantly impact the total energy output and economic payback period, even though they do not alter the fundamental threshold at which solar generation becomes cost-competitive with the local electrical grid.
| Irradiance Level | Daily Peak Sun Hours | Estimated LCOE | Grid Parity Path |
|---|---|---|---|
| High | 5.5 hours | 10¢/kWh | Accelerated (Lower Utility Rate Needed) |
| Low | 3.5 hours | 20¢/kWh | Delayed (Higher Utility Rate Needed) |
LCOE Sensitivity to Peak Sun Hours
The relationship between irradiance and your path to grid parity follows a distinct pattern based on annual output capacity:
- High-irradiance regions: Higher daily peak sun hours drive down the LCOE toward the 10¢/kWh floor, often reaching grid parity even if retail electricity rates are moderate.
- Low-irradiance regions: Lower daily peak sun hours push the LCOE toward the 20¢/kWh ceiling, requiring significantly higher retail utility rates to reach grid parity.
- System sizing requirements: If your area has fewer peak sun hours, you may need to install a larger array to reach the same production volume, which can delay parity if the increased installation cost outweighs the energy gains.
Analyze the average annual solar irradiance data for your specific rooftop orientation to determine if your potential energy yield is sufficient to offset the local retail rate within a 7-12 year payback period.
Beyond primary irradiance metrics, secondary site-specific factors further influence the speed at which your solar investment reaches financial maturity:- System Orientation and Tilt: Aligning panels toward the optimal compass heading and angle maximizes the capture of available peak sun hours.
- Local Utility Rate Structures: Regions with tiered or time-of-use pricing models can reach grid parity faster by offsetting the most expensive electricity usage periods.
- System Degradation Rates: High-quality hardware that retains efficiency over 30 years lowers the long-term LCOE compared to baseline projections.
- Incentive Integration: Federal tax credits and local rebates directly reduce the net capital expenditure, lowering the breakeven bar regardless of local irradiance levels.
Frequently Asked Questions
What is the difference between retail grid parity and wholesale grid parity for solar?
Retail grid parity occurs when the levelized cost of electricity (LCOE) of rooftop solar matches the retail rate a customer pays, whereas wholesale grid parity happens when the LCOE of utility-scale solar matches the lower cost of wholesale power or competing generation sources like gas or coal.
Does solar grid parity include the federal tax credit or is it measured without incentives?
Solar grid parity is typically measured as unsubsidized, although the federal tax credit can accelerate the timeline for achieving parity. The unsubsidized residential rooftop solar LCOE is about 10-20¢/kWh, which serves as the stricter test for determining if your system costs match your utility rates.
What caused solar grid parity: falling panel prices or rising electricity rates?
Solar grid parity was primarily driven by solar module prices falling roughly 90% or more between 2010 and the mid-2020s, though rising grid rates also play a significant role. As electricity prices increase faster than inflation, the gap between solar costs and grid power narrows, bringing parity closer for you.
Does grid parity mean solar is cheaper than grid power at all hours, including at night and with batteries?
No, grid parity does not mean solar is cheaper at all hours, as it primarily compares the annual levelized cost of electricity (LCOE) to grid rates. Real value depends on net metering, as export credits may be lower than retail rates, and nighttime usage often still requires grid or battery power.
How can I check whether my home has reached solar grid parity using my utility bill and a quote?
You can check if your home has reached grid parity by comparing your utility retail rate against the levelized cost of electricity (LCOE) calculated from your solar quote. If your solar LCOE falls within the 10-20¢/kWh range and matches or beats your utility rate, you have achieved grid parity.