
Growth of Photovoltaics: Price Decline, Installed Capacity, Annual Additions, Installed Cost, Efficiency, Electricity Share, Learning Rate, Lifespan, Technology Types
The growth of photovoltaics is the rapid worldwide rise in solar cell installations that convert sunlight directly into electricity. Key aspects include installed capacity, price decline, installed cost, annual additions, electricity share, efficiency, lifespan, learning rate, and technology types. You can follow this expansion through installed capacity, which counts the total power of all panels in operation, and through annual additions, which show how much new capacity is connected each year. Falling module prices and lower installed costs have made solar panels competitive with many other power sources, and these trends drive much of the rise. Within the field of solar panels, the same pattern appears at every scale, from rooftop arrays to large utility plants, and it shapes how PA solar energy is described in regional energy statistics. The article goes on to explain each of these measures, including the growing electricity share that photovoltaics supplies to power grids.
Key Takeaways
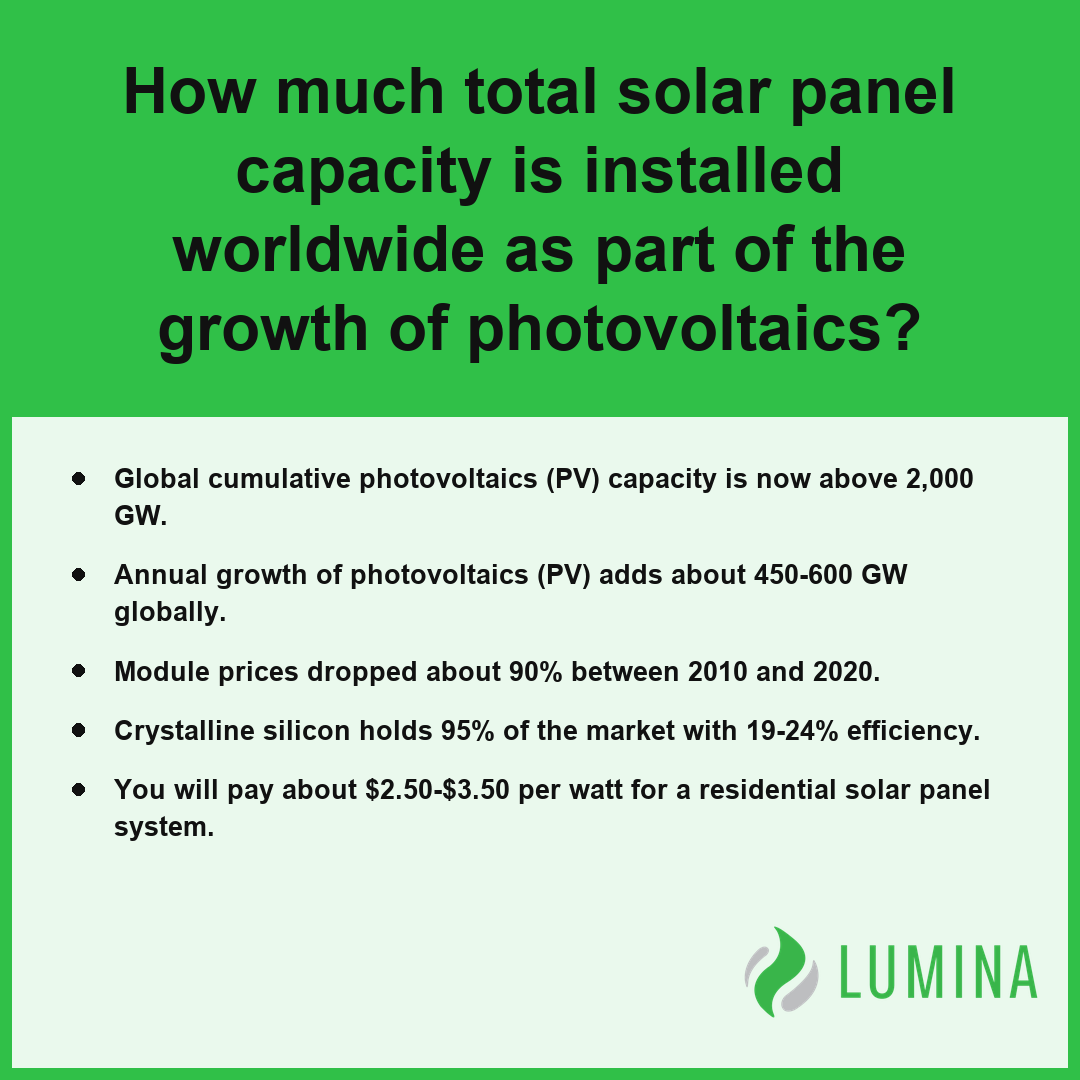
- Global cumulative photovoltaics (PV) capacity is now above 2,000 GW.
- Annual growth of photovoltaics (PV) adds about 450-600 GW globally.
- Module prices dropped about 90% between 2010 and 2020.
- Crystalline silicon holds 95% of the market with 19-24% efficiency.
- You will pay about $2.50-$3.50 per watt for a residential solar panel system.
How Much Total Solar Panel Capacity Is Installed Worldwide?
The total installed capacity of solar panel systems worldwide has surged. International Energy Agency reports that global solar photovoltaic capacity has reached a cumulative total exceeding 2,000 gigawatts as of recent industry assessments, surpassing this milestone by 2024-2025. This rapid growth of photovoltaics is driven by widespread adoption across both utility-scale arrays and distributed small-scale systems, where individual module efficiencies typically range between 19% and 24%. As more energy projects come online, the infrastructure supporting these systems continues to expand to meet rising electricity demand.
Solar Module Efficiency Ranges (%)
Which Regions Hold the Most Installed Capacity?
While solar expansion is a global phenomenon, the distribution of installed capacity is heavily concentrated in regions with strong policy support and favorable solar resources. Major economic powers currently account for the largest shares of this total, with domestic infrastructure projects often adding tens of gigawatts (GW) annually. You can evaluate the concentration of this capacity through the following categories:
- Large-scale utility zones: Concentrated in regions with extensive land availability for massive direct current (DC) arrays.
- Distributed rooftop sectors: Prominent in densely populated regions where residential and commercial demand for self-generation is high.
- Emerging markets: Rapidly scaling capacity to meet industrial electricity needs while decarbonizing the grid.
How Does Crystalline Silicon Compare With Thin-Film in Installed Capacity?
In terms of materials used to build global capacity, crystalline silicon remains the clear market leader, holding approximately 95% of the total installed base. The remaining portion of the market is largely serviced by thin-film technologies, which offer distinct performance profiles in specific conditions.
Why Crystalline Silicon Modules Dominate Shipments
| Technology Type | Market Share | Primary Strength |
|---|---|---|
| Crystalline Silicon | 95% | High commercial efficiency |
| Thin-Film | 5% | Flexible application versatility |
Compare the typical degradation rate of your chosen module technology against the expected local climate conditions to estimate the longevity of your system output.
The following factors are primary drivers for the recent surge in global solar capacity:- Decreasing levelized cost of electricity (LCOE) through advanced manufacturing economies of scale.
- Implementation of government-led feed-in tariffs and tax incentive frameworks.
- Rapid integration of utility-scale battery energy storage systems (BESS) to mitigate intermittency.
- Growth in corporate power purchase agreements (PPAs) that incentivize long-term renewable procurement.
How Many Gigawatts of Solar Panels Are Added Each Year, and Why Is Solar the Largest Source of New Capacity?
The annual growth of photovoltaics (PV) currently spans about 450-600 GW of new capacity added each year, making solar panel installations the leading source of new electricity generation worldwide. This dominance occurs because the levelized cost of electricity from new solar projects has fallen below most fossil fuel alternatives, allowing developers to scale projects rapidly while maintaining high returns on investment. Per the National Renewable Energy Laboratory, declining hardware costs and significant improvements in module efficiency have established solar photovoltaics as a primary contributor to utility-scale capacity growth across the United States. The transition toward solar is fueled by standardized manufacturing processes and the falling price of modules, which make grid-scale deployment faster to permit and construct than traditional thermal power plants.
| Performance Metric | Baseline Efficiency | Cost Trajectory | Deployment Advantage |
|---|---|---|---|
| Crystalline Silicon Module | 19% – 24% | 20-24% reduction per cumulative doubling | Modular, incremental scalability |
| Utility-Scale Photovoltaics | Leading global capacity | Sub-fossil fuel LCOE parity | Rapid permitting and construction |
Typical Crystalline Silicon Efficiency Ranges
Several technical and economic drivers explain why new grid additions are increasingly dominated by these systems:
- Modular design allows for incremental capacity increases rather than the lumpy, massive investments required for nuclear or coal infrastructure.
- The learning rate, which results in a 20-24% price reduction for every doubling of cumulative global shipments, consistently improves the financial viability of new builds.
- Advancements in crystalline silicon efficiency, which now typically reach 19-24%, mean that less land is required to hit specific capacity targets compared to older technologies.
- Governmental policy frameworks, such as investment tax credits, provide long-term predictability that incentivizes developers to prioritize PV over conventional generation.
Compare the anticipated levelized cost of electricity against the projected degradation rate of the specific module technology you are evaluating to ensure long-term project performance.
Beyond fundamental cost and efficiency metrics, these operational factors further accelerate the adoption of utility-scale solar:- Grid Integration: Advanced inverter technology enables reactive power control and voltage regulation, assisting grid stability during peak demand.
- Land-Use Optimization: Agrivoltaics and floating solar installations allow for dual-purpose site utilization, minimizing land competition.
- O&M Efficiency: Predictive maintenance through automated drone thermography and robotic cleaning systems significantly reduces long-term operational expenditures.
- Supply Chain Maturity: Global diversification of silicon sourcing and manufacturing hubs mitigates regional volatility in project development timelines.
How Far Have Solar Panel Prices Fallen as Photovoltaics Have Grown?
Solar panel prices have fallen dramatically as the growth of photovoltaics has accelerated due to consistent manufacturing improvements and economies of scale. According to the Department of Energy, solar photovoltaic module prices in the United States have declined by approximately 90% since 2009 due to technological advancements and economies of scale. Between 2010 and 2020 alone, module prices dropped by about 90%, a downward trend that continues to shape the market today. This consistent reduction is governed by the learning rate, which dictates that every time the cumulative global shipment of modules doubles, the price drops by roughly 20-24% through refinements in production and material efficiency.
| Manufacturing Advancement Factor | Primary Cost-Reduction Mechanism | Impact on Price per Watt |
|---|---|---|
| Economies of Scale | Overhead distribution across high-volume production | Significant reduction via per-unit cost dilution |
| Conversion Efficiency | Increased output from standardized wafer surface area | Lower cost per generated watt |
| Market Competition | Rapid innovation cycles and aggressive pricing | Wholesale compression to $0.10–$0.30 per watt |
| Supply Chain Maturity | Reduction in raw silicon waste during fabrication | Minimized material input costs |
| Learning Rate Effects | Cumulative shipment doubling (20–24% cost drop) | Consistent long-term price trajectory |
Typical Crystalline Silicon Module Efficiency
The following factors highlight how these manufacturing gains contribute to the lower costs you encounter when purchasing equipment:
- Scaling production: Larger factories allow manufacturers to spread overhead across more units, lowering the price per watt.
- Technological efficiency: Typical commercial crystalline silicon modules now reach 19-24% efficiency, providing more output for the same production cost.
- Market competition: High global demand has incentivized rapid innovation, pushing wholesale module prices down to a range of $0.10-$0.30 per watt.
- Supply chain maturity: Streamlined manufacturing processes for wafers and cells have reduced the amount of raw material waste during fabrication.
Evaluate the specific module technology and its degradation rate before you commit to a purchase, as the lowest price per watt may not always represent the best long-term value over a 25-30 year performance warranty.
Several factors beyond manufacturing and scale contribute to the overall economic viability of solar energy deployments:- Installation Labor Optimization: Improved mounting hardware and pre-assembled cabling reduce the “soft costs” associated with onsite construction time.
- Inverter Integration: Advances in power electronics allow for higher voltage configurations, reducing the total amount of copper wiring required per project.
- Regulatory Standardization: Streamlined permitting processes and uniform building codes decrease the duration and financial burden of pre-construction compliance.
- Lifetime Durability: Extended module warranties and lower annual degradation rates increase the total lifetime energy yield, effectively lowering the levelized cost of electricity.
What a Home Solar Panel System Costs per Watt After Photovoltaic Price Declines
The cost of a home solar panel system per watt ranges from about $2.50 to $3.50 before incentives, a price point heavily influenced by the sustained global growth of photovoltaics (PV) and the resulting economies of scale in manufacturing. Per Lawrence Berkeley National Laboratory, the median installed price for residential solar photovoltaic systems in the United States has fallen consistently over the past decade, reflecting lower hardware costs and improved installation efficiencies. When you look at the total investment for a typical 7-8 kilowatt (kW) system, you should expect to pay roughly $18,000 to $28,000. These figures reflect the comprehensive cost of your system, which extends beyond the modules themselves to include essential components and labor. The following list breaks down the primary cost drivers that determine your final price per watt:
| Cost Component | Proportion of Total Budget | Functional Role |
|---|---|---|
| System Hardware | 40% | Captures solar energy via high-efficiency crystalline silicon modules |
| Labor & Permitting | 30% | Covers professional installation, electrical wiring, and regulatory compliance |
| Structural Mounting | 20% | Provides the physical racking infrastructure for roof or ground arrays |
| Inverters | 10% | Converts captured DC electricity into usable household AC power |
Typical Cost Components (Estimated % of Total)
- System Hardware: High-efficiency crystalline silicon modules, which generally feature 19-24% efficiency, represent the primary equipment cost.
- Power Conversion: Your inverter is essential for transforming the direct current (DC) captured by your modules into the alternating current used by your home appliances.
- Structural Mounting: The racking and hardware required to secure your solar panel array to your roof or ground mount account for a fixed percentage of your total outlay.
- Labor and Permitting: Professional installation, electrical wiring, and the local regulatory approvals necessary to connect your system to the grid are included in the price per watt.
- Monitoring and Maintenance: Many modern installations include hardware to track your output over the 25-30 year panel performance warranty length, ensuring your system performs as expected.
Compare the quotes you receive against your local average cost per watt to identify if your specific installation faces unique pricing challenges due to roof complexity or site-specific grid connection requirements.
Beyond these primary capital costs, several external factors can further adjust your final investment:- Roof Condition: Upgrades or repairs required to support the weight of solar arrays can increase initial project expenditures.
- System Monitoring: Optional web-enabled software packages provide real-time energy production data and performance alerts.
- Battery Storage: Integrating lithium-ion battery units allows for energy independence during grid outages but significantly raises total system costs.
- Geographic Incentives: State-specific tax credits, rebates, and renewable energy certificates can offset your out-of-pocket expenses beyond federal policies.
What Percentage of Electricity Does Solar Supply, and Why Is Its Share Smaller Than Its Share of New Capacity?
The share of electricity supplied by solar is about 7-9% of utility-scale and small-scale generation, a figure that remains smaller than the share of new capacity because of the historical legacy of the existing power grid and the nature of intermittent energy production. While the rapid growth of photovoltaics has consistently made solar the leading source of new electrical infrastructure, the vast majority of current generation still relies on older, long-lived thermal power plants that were constructed decades ago. Because these existing facilities continue to operate, they occupy a significant portion of the total electricity supply, which limits how quickly new solar panel installations can increase the overall percentage of power generated.
| Generation Resource Type | Typical Operational Lifespan (Years) | Primary Role in Grid | Generation Profile |
|---|---|---|---|
| Thermal (Coal/Nuclear/Gas) | 30 – 50 | Baseload Power | Constant/Predictable |
| Photovoltaic (Solar) | 25 – 30 | Intermittent/Variable | Diurnal (Sunlight Dependent) |
Typical Power Plant Service Life (Years)
Several technical and logistical factors explain why the growth of photovoltaics does not immediately translate into an equal share of total power generation:
- Grid longevity: Conventional power plants typically remain in service for 30 to 50 years, anchoring the total supply despite the recent surge in solar additions.
- Energy intermittency: Solar generation follows a diurnal pattern, meaning that while new installations provide massive capacity during peak sunlight, the total output must be balanced against demand that persists during nighttime hours. The U.S. Energy Information Administration reports that utility-scale solar power plants typically operate at a lower annual capacity factor than traditional baseload sources like nuclear or natural gas, which results in less total electricity generation per megawatt of installed capacity.
- Infrastructure lag: Expanding the reach of solar requires massive upgrades to transmission lines and energy storage systems to integrate the high volume of new capacity into the legacy grid.
Examine the specific time-of-use rates provided by your local utility to understand how your consumption patterns align with the availability of solar energy on the grid.
Several logistical and grid-management variables further constrain the transition speed beyond mere infrastructure lifespan:- Transmission latency: Existing power plants are often situated near legacy transmission corridors, whereas new solar arrays frequently require costly high-voltage grid upgrades to connect to demand centers.
- System inertia: Thermal plants utilize heavy rotating turbines that provide essential grid frequency stability, a physical characteristic that intermittent solar must replicate through sophisticated power electronics or battery storage.
- Capacity factor variance: Solar generation is limited by daily and seasonal cycles, necessitating a higher installed capacity than thermal plants to achieve an equivalent annual energy output.
Frequently Asked Questions
What is Swanson’s law and how does the growth of photovoltaics keep lowering module prices?
Swanson’s law states that each doubling of cumulative global shipments has cut module prices by roughly 20-24%. This learning rate allows the growth of photovoltaics to drive down costs through manufacturing at scale, building on a foundation where module prices fell about 90% from 2010 to 2020.
How efficient are solar panels today, and will perovskite tandem cells drive the next stage of photovoltaic growth?
Typical commercial crystalline silicon module efficiency is about 19-24%, while perovskite-silicon tandem cells have exceeded 33% in the lab. These advanced materials will likely drive the next stage of development by offering higher energy density, supporting the continued rapid expansion and overall growth of photovoltaics.
Which solar panel technology dominates photovoltaic growth: PERC, TOPCon, heterojunction, back-contact, or thin-film?
Crystalline silicon makes up about 95% of the market and dominates current trends. Within this category, various forms like PERC, TOPCon, heterojunction, and back-contact designs compete, while thin-film types such as cadmium telluride hold most of the remaining market share, all contributing to the global growth of photovoltaics.
How long do solar panels last, and how much output do they lose as they age?
Typical panel performance warranties last 25-30 years, during which modules experience a degradation rate of about 0.4-0.6% per year. Consequently, you can expect your solar panels to retain roughly 85-90% of their initial output after 25 years, ensuring long-term reliability for the growth of photovoltaics.
How long does it take a solar panel to repay the energy used to manufacture it?
Solar panels typically repay the energy required for their manufacture within one to four years of operation, depending on location and module type. This energy payback period is a critical metric demonstrating the efficiency and environmental sustainability that supports the rapid, large-scale global growth of photovoltaics.