
Electricity Generation: Output, Capacity, Methods, Cost, Efficiency, Sources, Mix, Variability, Emissions
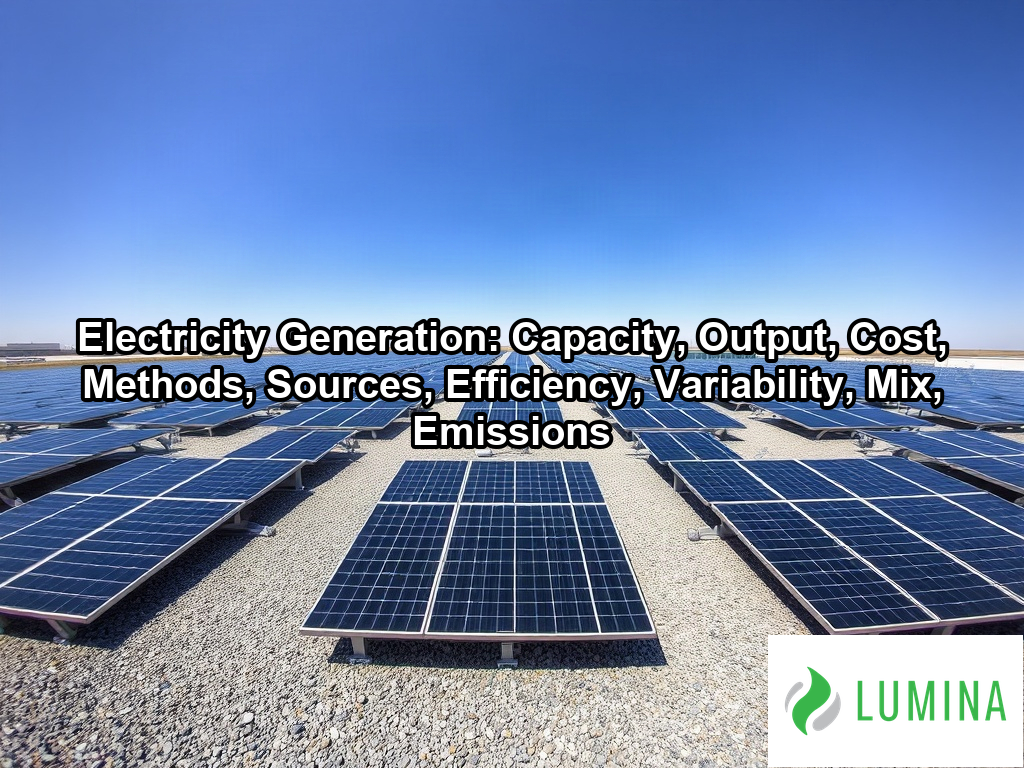
Electricity generation is the process of converting energy from a primary source, such as sunlight, into usable electrical power. Key aspects include capacity, output, cost, methods, sources, efficiency, variability, mix, and emissions. In a solar panel system, photovoltaic cells absorb sunlight and release electrons, which creates a direct current that an inverter converts into the alternating current your appliances use. This makes solar panels one of the main ways to produce power without burning fuel, and PA solar power is one example of how this approach applies across a specific region. The amount you produce depends on panel capacity, measured in kilowatts, along with sunlight hours, roof angle, shading, and equipment efficiency. This article goes on to explain the main methods of solar generation, how capacity is rated, how much output you can expect over a day or a year, and what the costs involve.
Key Takeaways
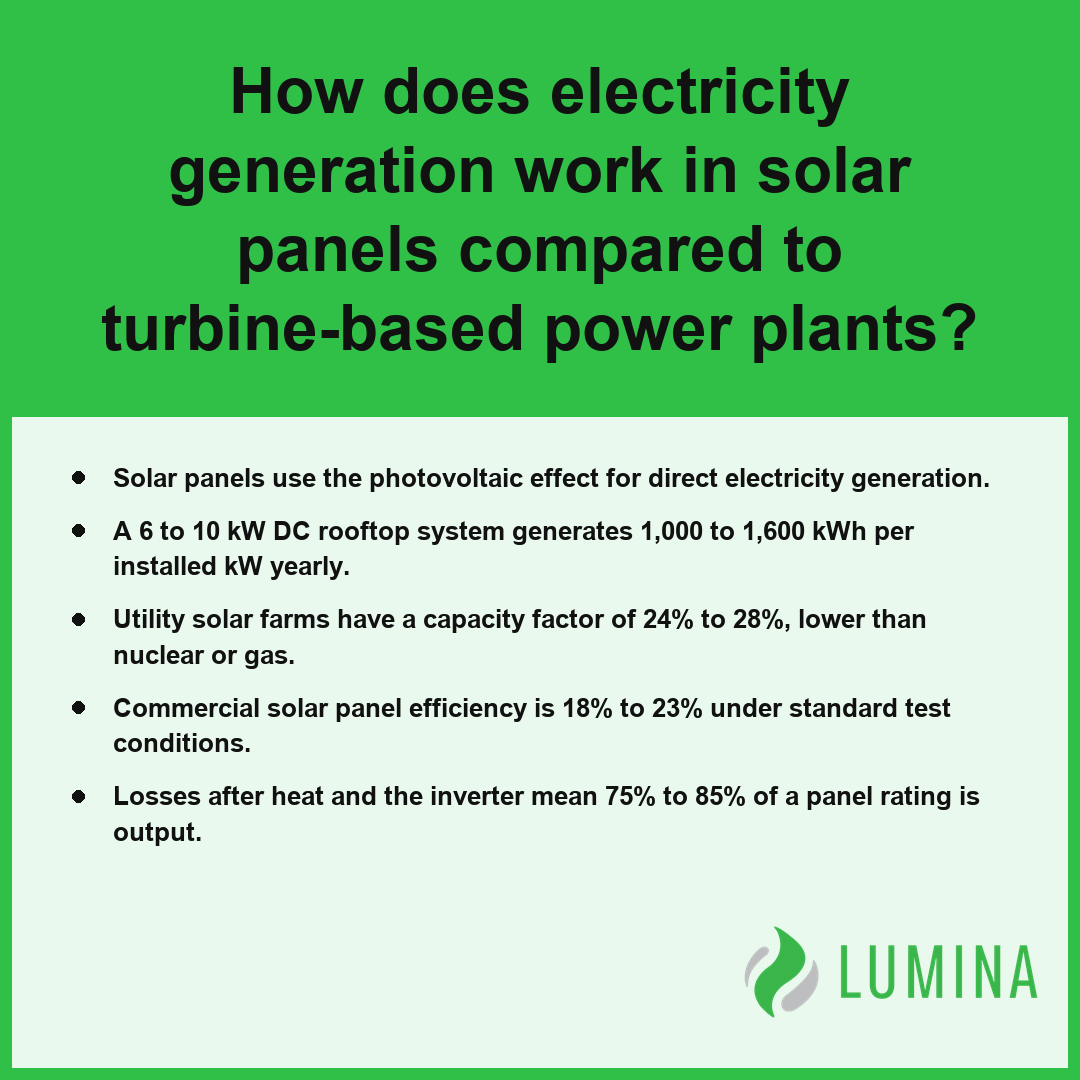
- Solar panels use the photovoltaic effect for direct electricity generation.
- A 6 to 10 kW DC rooftop system generates 1,000 to 1,600 kWh per installed kW yearly.
- Utility solar farms have a capacity factor of 24% to 28%, lower than nuclear or gas.
- Commercial solar panel efficiency is 18% to 23% under standard test conditions.
- Losses after heat and the inverter mean 75% to 85% of a panel rating is output.
How Does Electricity Generation Work in Solar Panels Compared to Turbine-Based Power Plants?
While turbine-based power plants generate electricity through the mechanical rotation of a generator via steam or wind, a solar panel achieves electricity generation by using the photovoltaic effect to convert light directly into direct current before passing it through an inverter for use on the grid.
Electrical Frequency Standard
Direct Photovoltaic Conversion in a Solar Panel
Electricity generation in a solar panel occurs through the photovoltaic effect, which directly transforms photons from sunlight into electrical current without mechanical movement. According to the National Renewable Energy Laboratory, photovoltaic systems generate direct current electricity without any moving parts, whereas traditional turbine-based generation relies on mechanical components such as rotors and shafts to produce alternating current. When light strikes a solar cell, it dislodges electrons, creating a direct current. To ensure this electricity generation is compatible with your household appliances, an inverter is essential.
Where an Inverter Fits In
Because solar panels produce direct current, the inverter serves as the critical bridge to convert this energy into the 60 Hz alternating current required by the grid and your home. Without this conversion process, the power generated by your rooftop system would remain unusable for standard appliances.
Turbine-and-Generator Induction in Conventional Plants
In contrast, most conventional power plants rely on turbine-based electricity generation using electromagnetic induction. This process involves a high-pressure medium—such as steam from burning fossil fuels or nuclear fission, water flow, or wind—to spin a rotor inside a magnetic field. This mechanical rotation induces an alternating current directly.
Which Losses Matter Most for Each Method?
Both methods face distinct efficiency hurdles that impact total electricity generation. While conventional plants manage thermal waste, solar systems deal with efficiency limits and environmental factors.
| Factor | Solar PV Impact | Conventional Turbine Impact |
|---|---|---|
| System Losses | 75% to 85% real output | Thermal conversion inefficiencies |
| Heat Sensitivity | 0.3% to 0.4% loss per °C | Friction and cooling limits |
Compare the anticipated temperature coefficients of your chosen hardware to estimate how much summer heat will degrade your daily electricity generation.
The following operational requirements must be met to integrate solar-generated electricity into the grid:- Maximize exposure by orienting panels toward the equator to ensure consistent photon absorption throughout the day.
- Install Maximum Power Point Tracking (MPPT) controllers to dynamically adjust electrical loads, optimizing output despite fluctuating light conditions.
- Synchronize the inverter output phase with the utility grid frequency to allow for seamless energy export and bi-directional metering.
- Implement surge protection devices to safeguard the inverter’s sensitive internal circuitry from voltage spikes occurring on the distribution line.
How Many kWh Your Solar Panels Generate per Year Compared With Your Home’s Use
The number of kilowatt-hour (kWh) units your solar panels generate per year compared with your home’s use depends on the size of your rooftop system and your local climate, as a typical 6 to 10 kW DC system yields 1,000 to 1,600 kWh per installed kW annually. According to the U.S. Energy Information Administration, the average annual electricity consumption for a typical U.S. residential utility customer is approximately 10,500 kilowatt-hours, so you must weigh your specific consumption patterns against your available roof space and orientation to determine how much of your total annual electricity generation can be offset by solar. While a 6 kW system might cover a significant portion of an average household’s demand, real output is often constrained to 75% to 85% of a panel’s rating due to wiring, heat, and inverter losses.
| System Specification | Key Metrics & Performance Factors |
|---|---|
| Average U.S. Annual Residential Consumption | 10,500 – 11,000 kWh |
| Annual Generation Yield (per installed kW) | 1,000 – 1,600 kWh |
| Real-World Operational Efficiency | 75% – 85% of nameplate rating |
| Annual Performance Degradation | 0.3% – 0.5% per year |
| Thermal Output Sensitivity | -0.3% to -0.4% per °C above 25°C |
Annual Kilowatt-Hour Generation Potential per Installed kW
- Average annual home demand: 10,500 to 11,000 kWh
- Annual output per installed kW: 1,000 to 1,600 kWh
- Estimated real-world efficiency: 75% to 85% of nameplate rating
- Typical yearly panel degradation: 0.3% to 0.5%
Factors that influence whether your system meets your annual usage goals include the tilt of your panels, shading from nearby trees or structures, and the ambient temperature, which affects performance since output drops 0.3% to 0.4% per degree Celsius above 25 °C. Review your monthly utility statements from the past two years to identify your peak demand periods before finalizing your system size.
To optimize your solar installation for maximum efficiency, consider these additional site-specific planning factors:- Evaluate roof shading patterns caused by chimneys, trees, or neighboring structures, as these can disproportionately decrease total energy yield.
- Assess the pitch and orientation of your roof, as south-facing arrays in the Northern Hemisphere typically offer the most consistent annual production.
- Verify the structural integrity and remaining lifespan of your roof shingles to ensure they can support the hardware for the system’s 25-year service life.
- Analyze local net metering policies and utility buy-back rates, which determine the financial value of excess energy exported to the grid.
- Confirm local zoning regulations and homeowner association guidelines regarding panel placement and aesthetic requirements.
Is Solar Electricity Generation Cheaper Than Gas Power, and Why Your Bill Does Not Drop to Zero
Yes, solar electricity generation is often cheaper than gas power when considering the unsubsidized cost of new utility-scale production, which currently ranges from 3 to 6 cents per kWh. While this highlights the competitiveness of the technology, your monthly bill does not drop to zero because your local utility must maintain the infrastructure—such as transformers, distribution lines, and metering systems—required to keep your home connected to the grid. Even when your rooftop system provides most of your energy, you still rely on this network to supply electricity during nighttime hours or periods of high demand when your panels produce insufficient output. Per the U.S. Energy Information Administration, residential electricity bills do not drop to zero because they include fixed grid-connection fees and utility infrastructure maintenance charges that remain mandatory regardless of the electricity generated by an on-site solar system.
| Generation Source | Cost per kWh (Low) | Cost per kWh (High) | Economic Status |
|---|---|---|---|
| Utility-Scale Solar | 3 cents | 6 cents | Market Competitive |
| Natural Gas Power | 3 cents | 6 cents | Reference Benchmark |
| Costs represent unsubsidized new production estimates. | |||
Cost of Utility-Scale Electricity Generation (cents per kWh)
Your financial responsibility typically shifts from paying solely for the energy you consume to covering a mix of fixed and variable costs associated with grid maintenance and administrative overhead. The following factors explain why these costs persist despite your own electricity generation:
- Fixed grid connection fees: Charges applied to every customer to maintain the physical connection to the utility network.
- Grid-to-home transmission maintenance: Ongoing investments to ensure the safety and reliability of poles, wires, and substations.
- Public policy and regulatory charges: Costs often included in utility bills to fund state or local programs unrelated to your specific energy usage.
- Demand balancing: The necessary cost of keeping dispatchable generation reserves available for when your system cannot meet your instantaneous load.
Evaluate your local utility provider’s breakdown of fixed monthly service charges to understand the irreducible portion of your bill.
Beyond the energy consumption charges on your statement, these additional factors contribute to your monthly utility costs:- Fixed service fees for account administration and meter reading.
- Demand charges applied to residential accounts to cover peak-capacity availability.
- Public benefit charges used to fund state-mandated energy efficiency and renewable energy programs.
- Transmission and distribution delivery fees for moving electricity from central plants to your home.
The Difference Between kW and kWh When Sizing Solar Electricity Generation
The difference between kW and kWh when sizing solar electricity generation is the distinction between your system’s instantaneous power capacity and its total accumulated energy output. Per the US Department of Energy, a kilowatt (kW) represents the instantaneous rate of power generation capacity of a solar system, while a kilowatt-hour (kWh) represents the total energy produced over a specific period of time. Think of kW as the width of a pipe and kWh as the total volume of water that flows through that pipe over a set period.
| Metric Category | Technical Definition | Industry Benchmark Range |
|---|---|---|
| System Power Capacity (kW) | Instantaneous generation potential | 6 to 10 kW DC (Typical Residential) |
| Annual Energy Yield (kWh) | Cumulative output per unit of capacity | 1,000 to 1,600 kWh per kW annually |
| Photovoltaic Conversion | Efficiency of sunlight to electricity | 18% to 23% Efficiency |
| System Performance Factor | Real-world output vs. rated capacity | 75% to 85% Delivery Rate |
Panel Efficiency and Real-World Output Percentages
When you size a rooftop system, you are essentially determining how much hardware is required to meet your annual energy needs. Because the electricity generation of a system is influenced by factors like panel efficiency and environmental conditions, you must account for these technical variables to balance your capacity with your consumption habits:
- Kilowatts (kW): Represents the peak power rating of your solar panels, typically ranging from 6 to 10 kW DC for a standard rooftop system.
- Kilowatt-hours (kWh): Represents the total electricity generation, which varies from 1,000 to 1,600 kWh per installed kW each year depending on your local sun exposure.
- Efficiency Metric: Commercial solar panels typically operate with 18% to 23% panel efficiency, meaning only a fraction of the sunlight hitting the surface becomes usable energy.
- Real-world Output: Actual electricity generation is generally 75% to 85% of your system’s rated capacity after accounting for wiring, inverter, and thermal losses.
Analyze your historical utility statements to determine your total annual kWh consumption before finalizing the kW capacity of your array.
Follow these critical steps to accurately determine the hardware requirements for your specific site:- Analyze your previous 12 months of utility statements to identify your total annual energy consumption in kWh.
- Assess your roof’s solar irradiance, orientation, and tilt to determine the localized “peak sun hours” available for generation.
- Adjust your capacity calculations to account for local grid interconnection limits and net metering policy constraints.
- Factor in anticipated system degradation rates, which typically reduce panel output by 0.3% to 0.5% per year.
- Calculate the required surface area by dividing the total system kW by the power density of your selected panel technology.
What Capacity Factor Means and Why It Is Lower for Solar Than for Nuclear or Gas
Capacity factor is the ratio of actual electricity generation over a specific period compared to the maximum possible output if a system ran at full nameplate capacity 24 hours a day. Because solar panels depend entirely on daylight, their capacity factor is inherently limited by the rising and setting of the sun, as well as seasonal weather patterns. In contrast, thermal power plants like nuclear or gas facilities can operate continuously, adjusting their output to match grid demand regardless of the time of day.
| Energy Generation Source | Annual Capacity Factor (Average) | Primary Operational Constraint |
|---|---|---|
| Nuclear | 90% | Constant baseload generation; not weather-dependent |
| Gas Combined Cycle | 58% | Demand-based adjustment for load following |
| Wind | 34.5% | Variable atmospheric and wind speed conditions |
| Utility-scale Solar PV | 26% | Restricted by diurnal sunlight cycles and seasonality |
Average Annual Capacity Factors by Source
The differences in reliability and uptime across common sources of electricity generation are summarized below:
- Nuclear: 90% or higher capacity factor, providing constant baseload electricity.
- Gas Combined Cycle: 55% to 60% capacity factor, frequently used for peaking and load following.
- Wind: 33% to 36% capacity factor, contingent on variable wind speeds.
- Utility-scale solar PV: 24% to 28% capacity factor, restricted by daily sunlight cycles.
Per the US Energy Information Administration, utility-scale solar in the United States typically sees an annual capacity factor between 20% and 25% due to the intermittent nature of sunlight. While you might see high wattage ratings on equipment, these figures represent peak performance under standard test conditions that rarely persist in the real world. You should assess your local solar irradiance data to understand how the specific sun-hours in your region will influence your system’s actual contribution to your yearly needs.
Factors that influence these performance metrics beyond simple operational constraints include the following:- Maintenance scheduling and refueling outages, which are planned for periods of low grid demand to maximize seasonal availability.
- Geographic siting optimization, where proximity to prime wind corridors or high-irradiance regions significantly elevates output potential.
- Grid congestion and curtailment, which force some renewable sites to power down despite favorable environmental conditions.
- Technological degradation rates, which gradually reduce the efficiency and total output capacity of solar and wind hardware over decades of operation.
Frequently Asked Questions
Is battery storage a form of electricity generation when paired with solar panels?
No, battery storage is not a form of electricity generation when paired with solar panels because it stores rather than creates energy. While solar panels convert sunlight into electricity via the photovoltaic effect, batteries only hold that energy to be discharged for later use by the grid.
What share of U.S. electricity generation comes from solar panels compared to gas, nuclear, coal and wind?
The U.S. electricity generation mix consists of approximately 40% natural gas, 18% nuclear, 15-17% coal, 10% wind, and 7-9% solar. These sources contribute to a continuously balanced system where total output must match demand second by second to ensure stability across the electrical grid.
How efficient are solar panels at generating electricity, and how much does heat reduce their output?
Commercial solar panel efficiency is typically 18% to 23%, though real output is usually 75% to 85% of the rating after losses. Heat further lowers performance by 0.3% to 0.4% for each degree Celsius above 25 °C, meaning hot, sunny days do not provide maximum production.
How much electricity do solar panels generate at night or on cloudy days, and what happens to surplus power?
Solar panels generate zero electricity at night and reduced amounts during cloudy conditions, as their output is variable and sunlight-dependent. When you produce surplus power, you may utilize net metering to manage the balance, as the grid requires instantaneous supply to match the total demand from users.
How many grams of CO2 does solar electricity generation emit over its lifecycle, and how long until panels repay their manufacturing energy?
Lifecycle emissions of solar PV are 20 to 50 g CO2-equivalent per kWh. While specific payback time varies by sunlight and location, panels efficiently recover the energy used in their manufacturing throughout their operational lifespan, contributing to the broader landscape of low-carbon electricity generation.