
Photovoltaic: Power Rating, Efficiency, Cost, Real-world Output, Lifespan, Cell Types, Size and Weight, Inverter Options, Materials and Certification, Temperature Coefficient
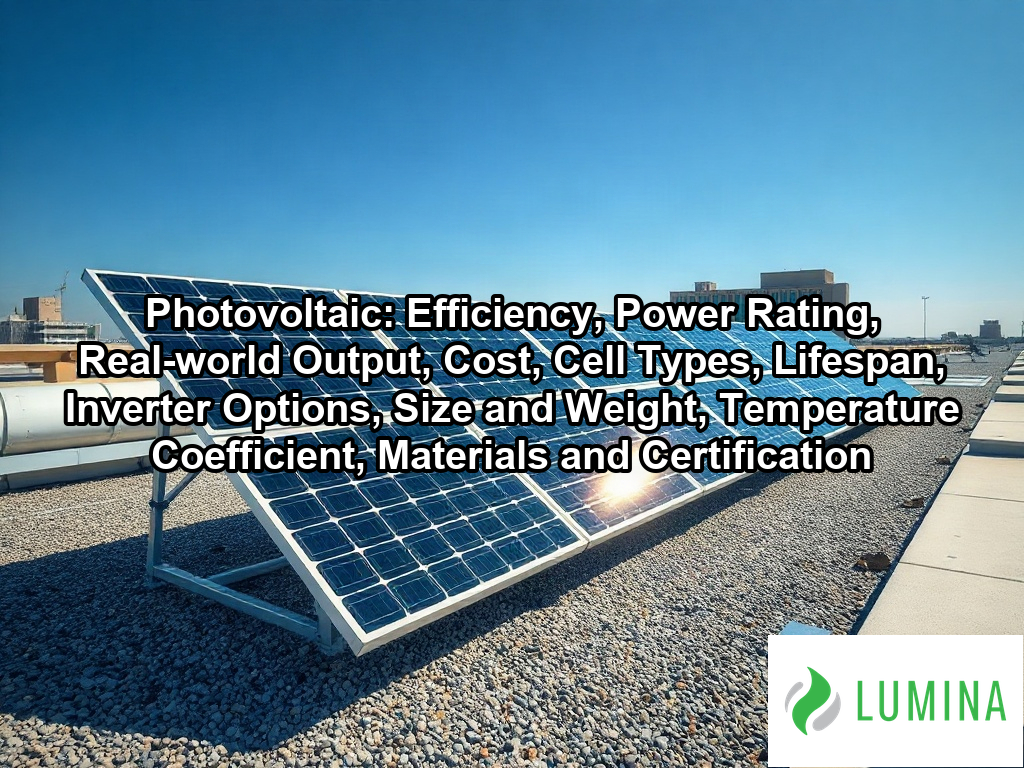
Photovoltaic technology converts sunlight directly into electricity using semiconductor materials that release electrons when light strikes them. Key aspects include efficiency, power rating, real-world output, cost, cell types, lifespan, inverter options, size and weight, temperature coefficient, and materials and certification. When sunlight hits a cell, it knocks electrons loose inside the semiconductor, and the resulting flow of current is captured as direct current that an inverter turns into the alternating current your home uses. Within solar panels, these cells are wired together under glass to form modules, and the type of cell largely determines how much power each panel produces from a given area. If you are looking into installing solar panels in Virginia, the same principles apply, though local sunlight, temperature and roof conditions shape what you actually receive. This article explains efficiency, the main cell types, how power ratings are stated, how real-world output differs from laboratory figures, and what drives the cost of a system.
Key Takeaways
- Commercial monocrystalline silicon photovoltaic (PV) modules reach 20-24% efficiency.
- Photovoltaic (PV) modules typically lose 14-20% of power due to system losses.
- Rated power for a solar panel is measured under Standard Test Conditions (STC).
- A 1 kW array typically yields 1,200-1,800 kWh per year depending on peak sun hours.
- Installed residential systems cost roughly $2.50-$3.50 per watt before incentives.
What Is the Efficiency of Photovoltaic Solar Panels?
The efficiency of a photovoltaic (PV) solar panel refers to the percentage of sunlight hitting the surface that is successfully converted into usable electricity. Most modern modules intended for homes fall within a 20% to 24% efficiency range, meaning a small portion of the available solar energy is captured while the rest is lost as heat or reflected.
| Solar Technology Type | Representative Efficiency Range | Primary Advantage | Ideal Installation Context |
|---|---|---|---|
| Monocrystalline Silicon | 20% – 24% | Maximum conversion density | Limited mounting surface area |
| Polycrystalline Silicon | 15% – 18% | Lower production costs | Budget-conscious, larger roof spaces |
| Thin-Film | ~16% | Flexible application profile | Specialized or non-standard surfaces |
Solar Panel Efficiency Comparison
Monocrystalline Silicon Efficiency
Why Monocrystalline Silicon Leads on Efficiency
Monocrystalline silicon is currently the industry standard for residential setups because its pure crystal structure allows for higher energy conversion rates. According to the National Renewable Energy Laboratory, efficiency ratings for mass-produced solar modules are primarily determined by the semiconductor material used, with monocrystalline silicon panels generally offering higher conversion rates than polycrystalline alternatives. By utilizing refined manufacturing processes, these cells reliably achieve commercial module efficiencies between 20% and 24%. Because these cells occupy less surface area for the same power output, they are the preferred choice when you have limited mounting space.
How Do Polycrystalline and Thin-Film Panels Compare?
While monocrystalline silicon dominates the market, other technologies exist with different performance profiles:
- Polycrystalline: These panels offer efficiencies of 15% to 18%; they are less expensive to manufacture but require more surface area to produce the same total wattage as monocrystalline options.
- Thin-Film: Materials like cadmium telluride typically reach 16% to 19% efficiency, making them more common in large utility-scale projects where land availability is not a constraint.
What Efficiency Means for Your Roof Space
Efficiency directly dictates how much power you can generate from a fixed area of your roof. Higher efficiency ratings allow you to fit a higher total capacity within a smaller footprint, which is critical if your roof has limited southern exposure or significant shading. As you plan your layout, compare the total square footage of your available roof planes against the manufacturer’s efficiency rating to determine the maximum possible system capacity.
Assess your roof’s total usable square footage to determine if high-efficiency modules are necessary to meet your target energy offset goals.
Several environmental and physical factors impact the real-world performance of these solar technologies:- Temperature Coefficient: High ambient temperatures can reduce voltage output, with thin-film panels generally maintaining better performance in extreme heat than silicon-based modules.
- Degradation Rate: Most panels experience a slight decrease in output annually, typically losing between 0.3% and 0.8% of their efficiency each year.
- Spectral Response: Different cell materials absorb specific wavelengths of the solar spectrum more effectively, influencing yield during overcast or low-light conditions.
- Inverter Compatibility: The efficiency of the overall system is dependent on the Power Conversion Efficiency (PCE) of the inverter paired with the module.
What the Wattage Rating Means Under Standard Test Conditions (STC)
The wattage rating under Standard Test Conditions (STC) represents the power output a photovoltaic solar panel is expected to produce when measured in a controlled laboratory environment. Because real-world environments are unpredictable, manufacturers use STC to create a baseline for comparing different modules regardless of their final installation location. Per the International Electrotechnical Commission, this wattage rating provides an approximation that establishes a consistent baseline for performance comparison without reflecting actual site conditions. To qualify for this rating, the equipment must perform under three specific metrics:
| STC Metric Parameter | Standardized Value | Functional Significance |
|---|---|---|
| Irradiance Level | 1,000 W/m² | Simulates peak solar intensity |
| Cell Temperature | 25°C | Baseline reference for thermal stability |
| Air Mass | 1.5 | Corrects for atmospheric light filtration |
| Temp. Coefficient Impact | -0.26% to -0.40% / °C | Predicts power loss above 25°C |
Typical Temperature Coefficient Range (% per °C)
- Irradiance level: 1,000 W/m² (simulating peak sunlight intensity)
- Cell temperature: 25°C (a moderate, cool reference point)
- Air mass: 1.5 (accounting for the light spectrum after passing through the atmosphere)
A typical residential module is rated at 400-450 watts under these defined constraints. It is vital to understand that this figure is a laboratory benchmark rather than a guaranteed daily energy yield. Because the rating relies on a fixed temperature of 25°C, your panels will often perform differently on your roof. As the actual cell temperature climbs above this 25°C threshold, the output drops according to the module’s temperature coefficient, which typically ranges from -0.26% to -0.40% per degree Celsius. Relying solely on the nameplate rating without accounting for these thermal fluctuations can lead to an overestimation of your system’s mid-day performance during the hottest months.
Compare the temperature coefficient listed on the product data sheet against the average high temperatures in your region to estimate how much your actual midday power delivery will deviate from the laboratory-tested wattage.
How Much Electricity a Photovoltaic System Actually Produces Compared With Its Nameplate Rating
A photovoltaic system produces electricity that typically falls 14-20% below its nameplate rating due to various environmental and electrical variables that affect real-world output. Per the Department of Energy, factors such as local solar irradiance, panel orientation, shading, and the accumulation of dust or debris are primary reasons why actual energy output often falls short of the standard test conditions used for nameplate ratings. While your solar panels are measured under Standard Test Conditions (STC) to determine their power potential, actual daily generation fluctuates as direct current (DC) encounters resistance from wiring, dust or soiling, and the inevitable conversion losses that occur when your inverter transforms it into usable alternating current (AC). Heat also plays a significant role; because silicon performance drops as temperatures rise, you should expect a power reduction of 0.26% to 0.40% for every degree Celsius the panels exceed 25°C.
Power Reduction per °C above 25°C
The following table illustrates the primary factors that cause a discrepancy between the theoretical nameplate capacity and the actual energy delivered to your home:
| Loss Factor | Description |
|---|---|
| Thermal Loss | Reduced efficiency as cells heat up above the 25°C threshold. |
| System Resistance | Voltage drop occurring across internal wiring and connections. |
| Conversion Inefficiency | Energy lost during the DC to AC inversion process. |
| Environmental Soiling | Accumulation of dirt, leaves, or snow blocking sunlight. |
To gain a more accurate estimate of your system’s performance, verify your local peak sun hours and apply a derate factor of 0.80 to 0.86 to your total nameplate wattage.
To minimize these inevitable performance gaps, consider the following maintenance and design strategies:- Schedule professional panel cleanings annually to mitigate losses caused by bird droppings, pollen, and industrial pollutants.
- Ensure adequate ventilation gaps between the roof surface and panels to facilitate convective cooling and reduce thermal losses.
- Monitor inverter performance metrics via manufacturer software to detect early signs of component degradation or wiring faults.
- Trim nearby vegetation or overhanging branches to prevent localized shading that disproportionately impacts string-inverter performance.
Photovoltaic Solar Panel Cost Per Watt: Panel Alone Versus a Full Installed System
The photovoltaic (PV) solar panel cost per watt varies significantly depending on whether you are purchasing the hardware alone or acquiring a full installed system. When you buy modules individually, you are paying for the core materials and manufacturing, whereas a full installation includes labor, permitting, racking, the inverter, and electrical grid connection hardware.
Solar Cost Comparison (Price per Watt)
| Cost Component | Estimated Price per Watt |
|---|---|
| Hardware Only (Panel) | $0.70 – $1.00 |
| Full Installed System | $2.50 – $3.50 |
The difference between the hardware price and the full installed cost represents the balance of system expenses. This gap covers critical components such as the mounting rails, the inverter required to convert direct current (DC) to alternating current (AC), and the labor costs for physical installation and electrical integration. According to Lawrence Berkeley National Laboratory, soft costs such as customer acquisition, installation labor, and administrative overhead often make up a larger portion of the total price per watt than the cost of the solar hardware itself. Because the labor and soft costs—such as site design and documentation—are often fixed regardless of the specific panel model, smaller systems may see a higher total cost per watt than larger arrays due to the lack of economies of scale.
Analyze your specific project size to determine if the increased efficiency of premium modules offsets the higher fixed labor costs relative to your total system capacity.
To optimize your total investment, consider these primary factors that influence the final price of your solar installation:- Roof Complexity: Installations on multi-level roofs or surfaces with unconventional materials require more labor hours and specialized mounting hardware.
- Permitting Fees: Local municipal regulations and utility interconnection application fees vary significantly by region and can impact the total cost per watt.
- Inverter Technology: Choosing between string inverters, power optimizers, or microinverters changes both the hardware cost and the complexity of the electrical integration.
- System Size: Smaller residential arrays often have higher administrative costs per watt because fixed overheads are spread across fewer panels.
Types of Photovoltaic Cells: PERC, TOPCon and Heterojunction Explained
Types of photovoltaic cells including PERC, TOPCon, and heterojunction represent advanced manufacturing architectures designed to capture more energy by minimizing electrical resistance and improving electron mobility within the semiconductor wafer. While traditional monocrystalline silicon serves as the base for these designs, the specific layering and doping techniques differ significantly in their approach to maximizing current flow.
| Cell Architecture | Primary Efficiency Mechanism | Thermal Performance Advantage | Structural Composition |
|---|---|---|---|
| PERC | Rear-surface light reflection | Standard | Passivated rear layer on monocrystalline wafer |
| TOPCon | Minimized recombination losses | Superior voltage potential | Ultra-thin oxide and doped silicon layers |
| Heterojunction (HJT) | Hybrid high-energy capture | Excellent at high temperatures | Crystalline silicon base with amorphous thin-film layers |
- PERC (Passivated Emitter and Rear Cell): This design adds a passivation layer to the rear of the photovoltaic cell, which reflects unabsorbed light back into the silicon for a second chance at conversion, significantly boosting efficiency compared to standard designs.
- TOPCon (Tunnel Oxide Passivated Contact): This technology incorporates an ultra-thin oxide layer and a doped silicon layer to reduce recombination losses, allowing for higher voltage potential and superior performance at elevated temperatures.
- Heterojunction (HJT): These cells combine crystalline silicon with layers of amorphous thin-film silicon, creating a hybrid structure that excels at capturing high-energy light and maintaining efficiency even when the panels reach high operating temperatures. According to the International Energy Agency, this specific integration of crystalline silicon wafers with amorphous thin-film layers is what enables these cells to reach elevated conversion efficiencies while maintaining excellent performance in high-heat conditions.
When selecting your equipment, compare the temperature coefficient of these specific cell architectures to ensure your chosen panels will maintain their rated performance on your most intense, high-heat summer days.
These advanced cell architectures each prioritize specific manufacturing trade-offs to optimize real-world energy production:- PERC provides the most cost-effective entry point for high-efficiency mass production, making it the current industry standard for residential rooftops.
- TOPCon allows for a seamless transition for existing production lines, as it shares significant structural similarities with standard PERC manufacturing processes.
- HJT offers a bifacial advantage by nature of its thin-film structure, significantly increasing total energy yield when installed on reflective surfaces.
- HJT manufacturing complexity is the highest of the three, often resulting in a premium price point compared to PERC and TOPCon modules.
Frequently Asked Questions
How big and heavy is a photovoltaic solar panel, and how many panels does a typical home need?
A typical residential solar panel is about 1.7 to 1.9 m by 1.1 m, weighs 40 to 50 pounds, and a home usually requires 15 to 25 panels for full offset. These 400-450 watt units are sized to meet the average annual demand of approximately 10,500 kWh.
How long do photovoltaic solar panels last, and how much output do they lose each year?
Photovoltaic solar panels typically last for a 25 to 30-year warranted lifespan, during which they experience a degradation rate of 0.4 to 0.5% per year. This gradual loss ensures that your solar panel array maintains a significant percentage of its original energy production capacity throughout its operational life.
How does heat affect photovoltaic solar panel output, and what is a temperature coefficient?
Heat reduces output by 0.26% to 0.40% for every degree Celsius above 25°C, a measure known as the temperature coefficient. Because high temperatures lower efficiency, your solar panel array performs best on cold, clear days where the voltage output can increase, helping to offset typical system losses.
Do photovoltaic panels need a string inverter, microinverters or power optimizers to convert DC to AC?
Yes, photovoltaic panels need an inverter, such as a string, microinverter, or power optimizer system, to convert direct current (DC) into alternating current (AC). This conversion is necessary to make the electricity produced by your solar panel array compatible with household appliances and for export to the grid.
What are photovoltaic solar panels made of, and which certifications like UL 61730 and IEC 61215 should they carry?
A photovoltaic cell is typically a thin semiconductor wafer made of silicon, and modules should carry certifications such as UL 61730 and IEC 61215 to ensure safety and performance standards. These units function via the photovoltaic effect to convert light into electricity within a durable, grid-connected photovoltaic system.