
Solar Performance Monitor: Accuracy, Types, Measurements, Cost, Resolution Level, Connectivity, Data Interval, Consumption Tracking, Alerts
A solar performance monitor is a device or software system that tracks how much electricity a solar panel array produces. Key aspects include types, accuracy, cost, measurements, connectivity, resolution level, consumption tracking, data interval, and alerts. It collects data from inverters, panel-level optimizers, or separate meters, then displays output, voltage, and energy totals on a screen, web portal, or app. You can use those readings to see whether your system is producing what its size and local sunlight suggest it should. Many PA solar installers include a basic monitoring platform with a system, while others add more detailed hardware as an option. Within solar panels as a whole, monitoring is the main way faults such as shading, dirty modules, or inverter errors become visible. This article goes on to explain the main types, the measurements they report, how accurate those figures are, what monitoring costs, and how the data reaches you through Wi-Fi, cellular, or wired connections.
Key Takeaways
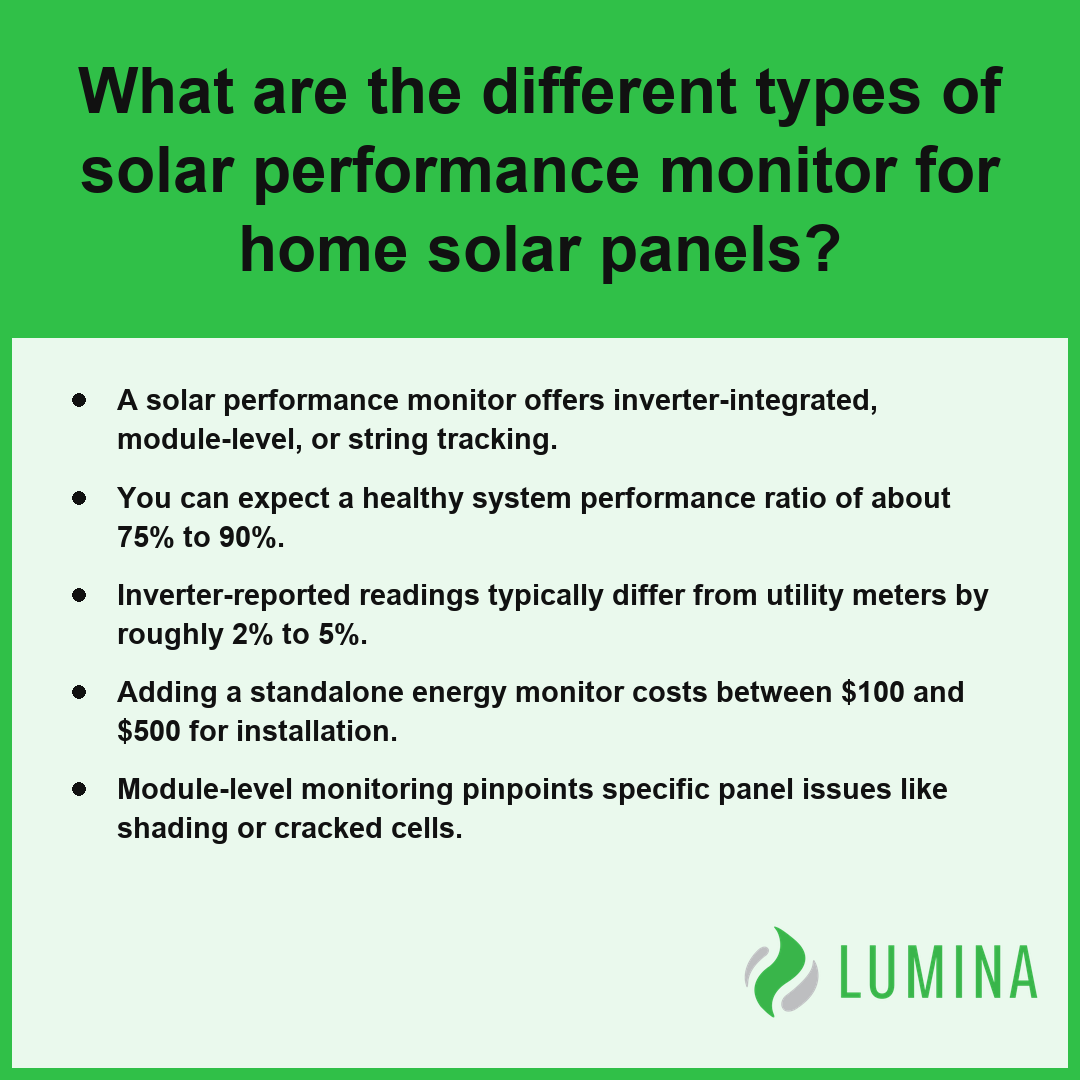
- A solar performance monitor offers inverter-integrated, module-level, or string tracking.
- You can expect a healthy system performance ratio of about 75% to 90%.
- Inverter-reported readings typically differ from utility meters by roughly 2% to 5%.
- Adding a standalone energy monitor costs between $100 and $500 for installation.
- Module-level monitoring pinpoints specific panel issues like shading or cracked cells.
Types of Solar Performance Monitor for Home Solar Panels
Types of solar performance monitor hardware range from basic systems built into your power conversion equipment to sophisticated, independent devices that track your energy flow with high precision. Choosing the right system depends on whether you require granular data on individual solar panels or a high-level view of your total home energy exchange.
Typical Measurement Error Range (Upper Bound %)
| Monitor Type | Data Scope | Primary Hardware | Accuracy |
|---|---|---|---|
| Inverter-integrated monitoring | Production monitoring | String inverter or microinverter | ±2% to ±5% |
| Module-level monitoring | Production monitoring | Microinverters or power optimizers | ±2% to ±5% |
| Standalone revenue-grade meter | Consumption/Production | CTs and external unit | ±0.5% |
Most systems utilize inverter-integrated monitoring, which transmits data to a cloud portal via your home network at a sampling interval of 5 to 15 minutes. While this is typically sufficient for tracking overall health, upgrading to module-level monitoring allows you to isolate underperforming solar panels caused by shading or debris. Per the National Renewable Energy Laboratory, string-level monitoring systems rely on individual microinverters or DC power optimizers to provide performance data for each solar panel in an array. If your priority is precise billing or total energy balance, you should install a system that supports current transformer (CT) connectivity for advanced consumption monitoring.
Compare the data granularity of your existing inverter against your specific needs for pinpointing individual panel performance before adding external metering hardware.
To ensure optimal performance and data integrity, consider these additional factors when selecting and maintaining your monitoring hardware:- Verify that your monitoring device is compatible with your specific internet connection type (Wi-Fi, Ethernet, or Cellular) to prevent data gaps.
- Check if the provider offers an open API, which allows you to integrate your solar data into third-party smart home automation platforms.
- Ensure your monitoring hardware is housed in a NEMA-rated enclosure if you are installing it in an outdoor or exposed environment.
- Schedule periodic firmware updates through the manufacturer’s portal to maintain security patches and data logging stability.
What a Solar Performance Monitor Measures Besides Kilowatt-Hours
Which Electrical Readings Reveal a Healthy Performance Ratio?
A solar performance monitor calculates a performance ratio, which compares your actual energy yield against theoretical expectations based on local sunlight. Per Department of Energy, advanced monitoring systems often use onsite pyranometers to measure solar irradiance data to determine this ratio relative to local weather conditions. Healthy systems typically maintain a performance ratio of about 75% to 90%. To troubleshoot deviations from this baseline, you should examine specific diagnostic metrics:
| Diagnostic Metric Category | Primary Data Source | Health Impact on Performance Ratio |
|---|---|---|
| Thermal Regulation | Inverter Internal Sensors | High heat triggers derating, dropping PR below 75% |
| Direct Current (DC) Input | String Combiner / MPPT Channels | Voltage drops indicate shading or module-level failures |
| Grid Interconnection | Utility-Side AC Output | Frequency or voltage fluctuations cause system shutdowns |
| Irradiance Calibration | Onsite Pyranometer | Essential for accurate theoretical yield calculations |
Typical Performance Ratio Range
- Inverter temperature and internal operating status
- DC voltage and current levels from the panels
- AC grid parameters to ensure stable interconnection
- Inspect inverter heat sinks periodically to ensure debris-free airflow and prevent thermal throttling.
- Verify that your monitoring software is synced with local meteorological data to maintain precise theoretical yield benchmarks.
- Review AC output logs for recurring voltage excursions that may indicate site-specific grid instability.
- Audit DC string currents during peak solar noon to identify latent shading issues or module degradation.
How Much It Costs to Add a Solar Performance Monitor to an Existing System
The costs to add a solar performance monitor to an existing system typically range from $100 to $500 for a standalone add-on energy monitor that you install at your main service panel. If your primary goal is to upgrade your current setup to include consumption monitoring or to gain better granularity, these units use a current transformer (CT) to measure household energy flows directly from your electrical feed. While inverter-integrated monitoring is usually bundled with your equipment at no extra charge, these standalone hardware additions provide a necessary bridge for systems lacking robust reporting features. Per the Solar Energy Industries Association, performance monitoring devices are frequently bundled with system upgrades or inverter replacements, which can impact the overall labor expenses involved in retrofitting an existing solar array.
Cost Breakdown of Monitoring Components (USD)
When budgeting for these upgrades, keep in mind that ongoing connectivity costs depend on your chosen infrastructure. Some systems utilize your existing home Wi-Fi or Ethernet for free, while others may require specialized hardware to maintain data flow. The following table breaks down typical financial considerations for expanding your monitoring capabilities:
| Component | Estimated Cost |
|---|---|
| Standalone add-on monitor hardware | $100 to $500 |
| Optional cellular gateway fee | $0 to $10 per month |
| Professional installation labor | Varies by regional rates |
Confirm the compatibility of any new monitoring hardware with your specific inverter model before purchasing to ensure the system can effectively communicate with your cloud portal. Verify the physical space available inside your electrical service panel to ensure there is enough room to safely mount the current transformer (CT) sensors.
To ensure a successful installation of your monitoring equipment, consider these additional site requirements:- Verify that your main electrical panel has sufficient physical space to accommodate the installation of the current transformer (CT) clamps.
- Ensure a stable Wi-Fi signal or a dedicated Ethernet port is available within close proximity to your service panel for data transmission.
- Confirm that your mobile device is compatible with the specific manufacturer’s application required for initial sensor calibration and dashboard configuration.
- Check local building codes to determine if a permit is required for electrical modifications, even if they are minor add-ons to an existing system.
Why Does My Solar Performance Monitor Show Different Numbers Than My Utility Meter?
Your solar performance monitor shows different numbers than your utility meter because these devices utilize different sensing technologies and record data with varying degrees of precision. While a utility meter is designed for high-accuracy billing, your solar performance monitor is primarily a diagnostic tool. Per Federal Energy Regulatory Commission, utility-grade meters are strictly regulated for revenue-grade billing accuracy to ensure compliance with net metering tariffs, whereas third-party performance monitors serve as informational tools for system diagnostics and may utilize different measurement sensitivities or communication frequencies. A revenue-grade meter maintains an accuracy of about ±0.5% according to the ANSI C12.20 standard, whereas standard inverter-integrated monitoring typically provides readings within a range of roughly ±2% to ±5%.
| Metric Category | Utility-Grade Billing Meter | Solar Performance Monitor |
|---|---|---|
| Primary Function | Revenue-Grade Billing | System Diagnostics |
| Accuracy Standard | ANSI C12.20 (±0.5%) | Internal Sensor (±2% to ±5%) |
| Data Focus | Net Grid Import/Export | Gross Generation & Consumption |
| Regulatory Oversight | Strict Federal/Utility Compliance | Informational/Voluntary |
| Sensor Calibration | Certified Legal Calibration | Non-Revenue Technical Sensing |
Measurement Accuracy Variance
Furthermore, these devices often track different metrics. A utility meter measures the net flow of electricity into and out of your home, while a solar performance monitor focuses on the generation side of your system. If you have installed a current transformer (CT) for consumption monitoring, the monitor may also calculate self-consumption, which further complicates direct comparisons to the totals logged by your utility company.
- Measurement Standards: Utility meters are calibrated for legal billing, while solar performance monitors serve as operational indicators.
- Sampling Frequency: Monitoring systems often report data at intervals of 5 to 15 minutes, which may miss transient fluctuations captured by a utility meter.
- Calculation Methodology: Inverters may report AC output while excluding internal power consumption, whereas utility meters measure the final import/export balance at the service point.
- Sensor Type: Dedicated revenue-grade meters use precision current transformers (CT) that offer tighter tolerances than standard inverter-integrated monitoring equipment.
Review the specific technical documentation for your inverter to determine if it measures AC power before or after internal electrical losses.
Consider these additional factors that may contribute to discrepancies in your reported data:- Sampling Intervals: Inverter monitors often aggregate data over several minutes, whereas utility meters calculate instantaneous demand at high-frequency intervals.
- Internal System Losses: Solar performance monitors measure power directly from the inverter, meaning they do not account for transmission losses occurring between the inverter and the point of grid interconnection.
- Communication Latency: Delays in data transmission from the monitoring hardware to the cloud platform can cause temporary alignment gaps when compared to the real-time readings of a physical utility meter.
- Power Factor Differences: Utility meters account for reactive power to calculate billing, while many standard performance monitors focus primarily on active power (kW).
Can a Solar Performance Monitor Work Without Internet, and What Happens When Wi-Fi Drops?
Yes, a solar performance monitor can function without a constant internet connection, although your ability to view real-time data will be limited until the link is restored. Most modern equipment includes local data storage, allowing the system to buffer information during outages or Wi-Fi disruptions. Once the connection is re-established, the system automatically transmits the backlogged data to your cloud portal, ensuring no long-term gaps appear in your energy history.
| Connection Method | Monthly Cost | Data Transmission Reliability | Setup Requirement |
|---|---|---|---|
| Wi-Fi | $0 | Variable (Subject to router proximity) | Wireless Network Access |
| Ethernet | $0 | High (Physical hardline) | Router Port Access |
| Cellular Gateway | $10 | High (Independent of home network) | SIM/Modem Activation |
Monthly Connectivity Costs
- Local Data Buffering: Many inverters can store several days or even weeks of production data internally when the internet is unavailable. Per the International Electrotechnical Commission, industry standards for photovoltaic system monitoring require that data acquisition units include non-volatile memory buffers to ensure energy production records are not lost during network or Wi-Fi interruptions.
- Sampling Limitations: During an outage, you cannot view the typical 5 to 15 minutes of sampling interval updates on your smartphone app.
- Connectivity Options: If your home Wi-Fi is unreliable, you can often switch to a wired Ethernet connection or install an optional cellular gateway for $0 to $10 per month to maintain a stable link.
- System Operation: Your solar panels continue to generate electricity and send it to the grid or your home regardless of whether the solar performance monitor is connected to the network.
- Alert Delay: Essential notifications regarding ground faults or communication loss will not reach your device until the system regains internet access.
Inspect your inverter or communications gateway for physical status lights that indicate whether the device is currently attempting to re-establish a handshake with your local network.
Consider these factors when choosing a connectivity method for your monitoring system:- Signal strength: Ensure your Wi-Fi router is within range of the inverter to prevent frequent connection drops.
- Network security: Using an isolated guest network for your solar equipment can protect your primary home devices.
- Hardwired redundancy: Run a dedicated Ethernet cable during installation to avoid future interference issues caused by home appliance signals.
- Cellular coverage: Verify local mobile signal strength at the installation site before selecting a cellular gateway plan.
Frequently Asked Questions
How often does a solar performance monitor update its readings?
A solar performance monitor typically updates its readings using a common sampling interval of 5 to 15 minutes. Some systems provide data faster, at intervals of one minute or less. These measurements travel through Wi-Fi, Ethernet, or a cellular gateway to a cloud portal for you to review.
Can a solar performance monitor find a single underperforming panel?
Yes, a solar performance monitor can find a single underperforming panel if you use module-level monitoring. While string-level monitoring only reports data for the entire array, module-level monitoring pinpoints issues like shading, soiling, or failed optimizers on individual solar panels to help you isolate exactly where the fault occurs.
Do I need consumption CTs on my solar performance monitor to see grid import, export, and self-consumption?
Yes, you need consumption CTs installed on your main service feed to see grid import, export, and your self-consumption percentage. While standard production monitoring only tracks what your system generates, adding these sensors allows the software to calculate your total household energy usage relative to your solar power production.
What alerts does a solar performance monitor send, and which ones need immediate action?
A solar performance monitor sends alerts for issues like inverter offline, communication loss, ground faults, arc faults, low production, or grid outage shutdowns. You should treat faults related to system safety, such as arc faults or ground faults, as immediate concerns that require a professional inspection to prevent potential hazards.
What is a normal performance ratio on a solar performance monitor, and when does a drop in output mean a fault?
A healthy system typically shows a performance ratio of about 75% to 90%. While a gradual decline of 0.5% per year due to panel degradation is normal, a sudden drop of over 10% to 20% in your solar performance monitor output suggests an underlying fault requiring your attention.