
Spectrum: Reference Standard, Wavelength Range, Energy Split, Conversion Efficiency, Spectral Response, Bandgap, Weather Effects, Energy Losses, Temperature Sensitivity, UV Degradation
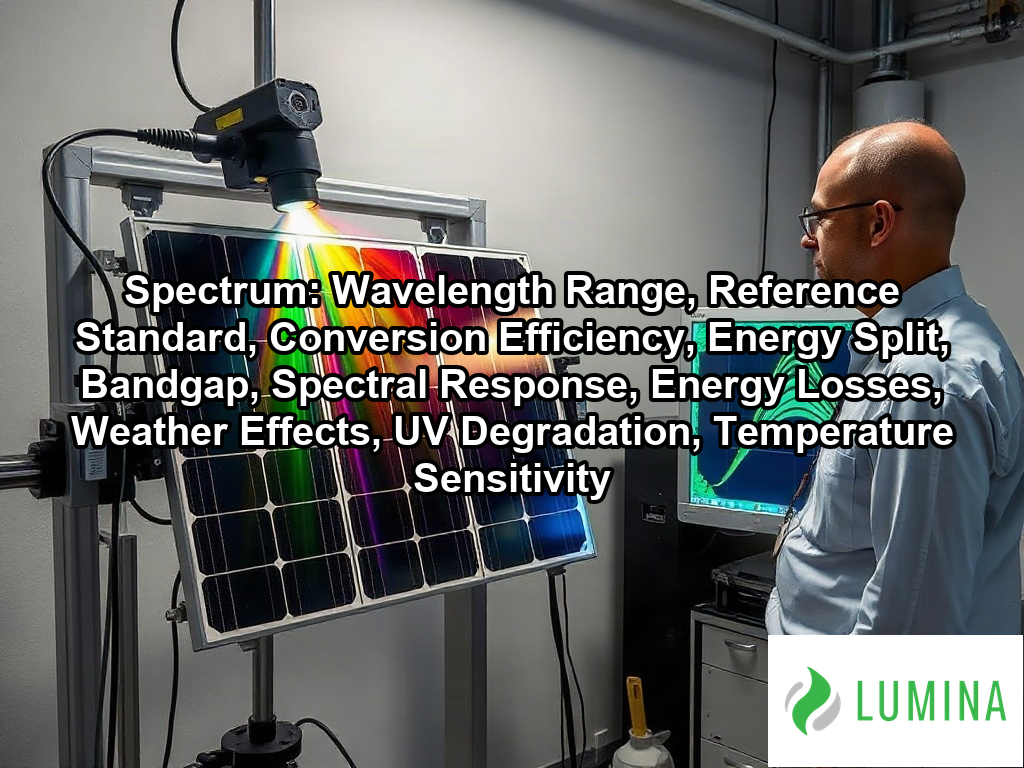
A spectrum is the range of electromagnetic wavelengths that sunlight carries, spanning ultraviolet, visible and infrared light. Key aspects include wavelength range, reference standard, conversion efficiency, energy split, bandgap, spectral response, energy losses, weather effects, UV degradation, and temperature sensitivity. Solar cells respond to only part of this range, because each photon’s energy must match the bandgap of the semiconductor, usually silicon. Photons below the bandgap pass through, while excess energy in higher-energy photons is lost as heat, which limits conversion efficiency. Panels are rated under a reference standard, a fixed sunlight distribution and temperature, so results can be measured consistently across products. Washington DC solar installers work with these ratings when they estimate how much of the available sunlight a system turns into electricity at your property. The sections below explain the wavelength range, the energy split, the bandgap, the reference standard and the resulting conversion efficiency.
Key Takeaways
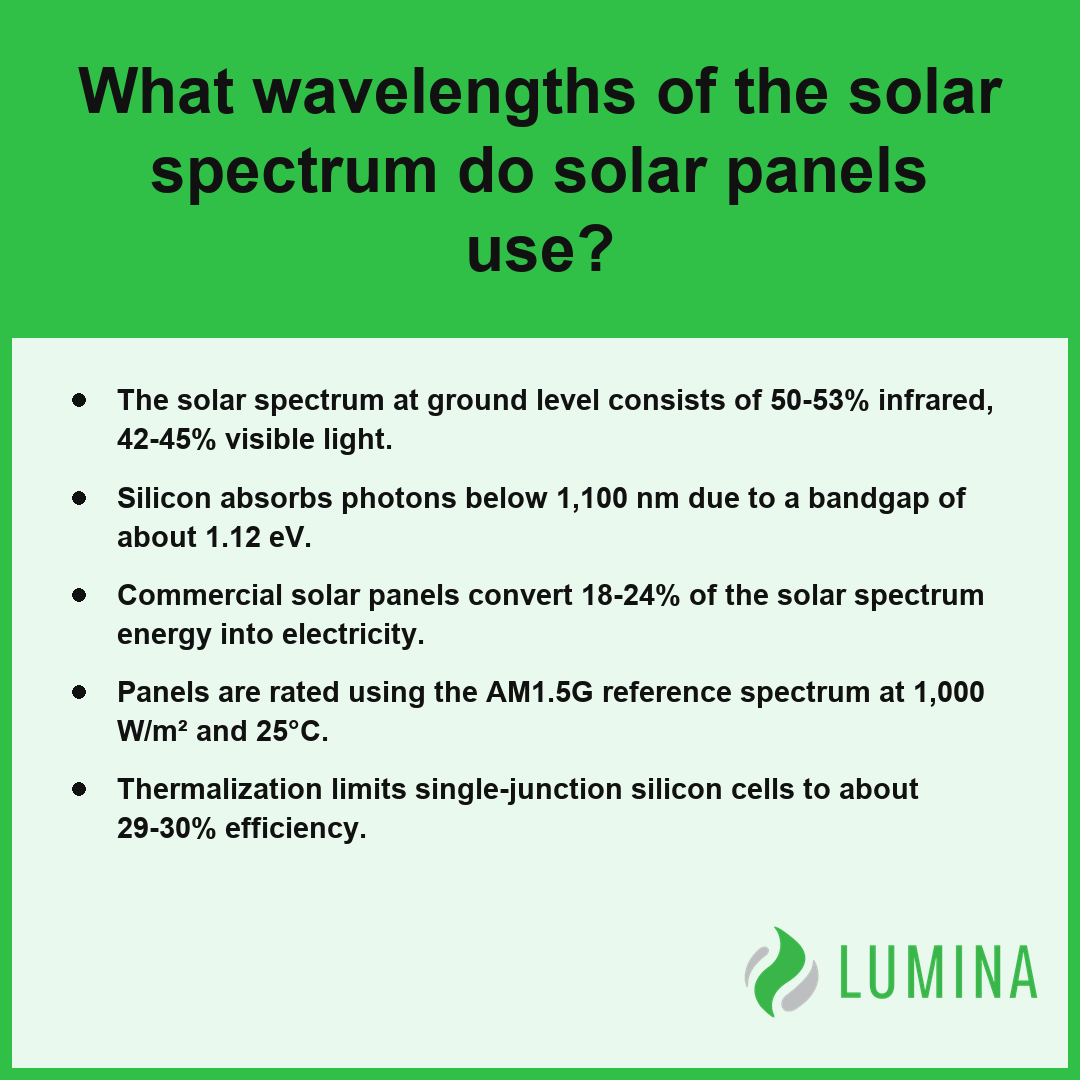
- The solar spectrum at ground level consists of 50-53% infrared, 42-45% visible light.
- Silicon absorbs photons below 1,100 nm due to a bandgap of about 1.12 eV.
- Commercial solar panels convert 18-24% of the solar spectrum energy into electricity.
- Panels are rated using the AM1.5G reference spectrum at 1,000 W/m² and 25°C.
- Thermalization limits single-junction silicon cells to about 29-30% efficiency.
What Wavelengths of the Solar Spectrum Do Solar Panels Use?
Solar panels use the solar spectrum by converting photons with specific energies into electricity, primarily focusing on visible light and near-infrared wavelengths that align with the silicon bandgap. Per the National Renewable Energy Laboratory, standard silicon photovoltaic cells primarily convert solar energy into electricity from wavelengths ranging from approximately 300 nanometers to 1200 nanometers.
Silicon Responsiveness by Wavelength (A/W)
Visible and Near-Infrared Wavelengths Silicon Captures
Silicon cells effectively harvest photons that possess energy levels greater than or equal to the silicon bandgap of about 1.12 eV. This allows them to capture wavelengths starting from the violet edge of visible light through the near-infrared range up to roughly 1,100 nm.
Why Peak Spectral Response Sits Between 800 nm and 1,000 nm
While the solar spectrum contains high-intensity visible light, the silicon crystal structure is most efficient at converting photons just above its bandgap energy, which corresponds to the near-infrared region. The following table illustrates the external quantum efficiency (EQE) and responsiveness of silicon:
| Wavelength Range | Silicon Behavior | Efficiency/Response |
|---|---|---|
| 400–700 nm | Visible Light Capture | High EQE |
| 800–1,000 nm | Peak Spectral Response | 0.6–0.7 A/W |
Ultraviolet and Far-Infrared Wavelengths Panels Waste
Standard panels fail to utilize large portions of the solar spectrum because of inherent physical limitations. Ultraviolet photons, which are below 400 nm, contain energy far exceeding the bandgap; these photons lose their excess energy through thermalization, turning into heat rather than electricity. Conversely, photons with wavelengths longer than 1,100 nm—found in the far-infrared—lack sufficient energy to excite electrons across the bandgap, causing them to pass through the cell entirely.
Which Wavelengths Does a Tandem Cell Add?
A tandem cell expands the captured spectrum by stacking materials with different bandgaps. By placing a wide-bandgap layer, such as a perovskite, on top of silicon, the device can effectively convert high-energy ultraviolet and blue light that a standard silicon cell would otherwise waste as heat. This dual-layer approach allows the panel to extract electrical current from parts of the solar spectrum that single-junction cells ignore.
Review the manufacturer’s datasheet for the spectral response curve to determine how well a specific panel model aligns with your local sunlight conditions.
Standard silicon photovoltaic cells experience specific limitations when interacting with photons outside their ideal conversion range:- Ultraviolet photons possess excessive energy, causing thermalization where surplus energy is lost as waste heat.
- Far-infrared photons lack sufficient energy to overcome the 1.12 eV bandgap, allowing them to pass through the cell without generating current.
- Surface reflection and internal shading from electrical contacts further reduce the total number of photons available for conversion.
How Silicon Bandgap Determines the Part of the Solar Spectrum a Panel Absorbs
The silicon bandgap determines the part of the solar spectrum a panel absorbs by acting as an energy threshold that dictates which photons possess sufficient force to create an electrical current. Because silicon has a bandgap of about 1.12 eV, it only facilitates the excitation of electrons when the incident photons carry enough energy to cross this gap, which corresponds to wavelengths shorter than approximately 1,100 nm. According to the Department of Energy, photons with energy lower than the silicon bandgap pass through the solar cell without generating an electron-hole pair, representing a fundamental loss mechanism in standard photovoltaic energy conversion. Conversely, when a photon has significantly more energy than the 1.12 eV requirement, the excess is released as heat through thermalization, rather than being converted into electricity.
| Performance Metric | Operational Range / Threshold | Observed Efficiency or Value |
|---|---|---|
| Silicon Bandgap Energy | 1.12 eV | Fundamental Activation Threshold |
| Spectral Absorption Cutoff | ~1,100 nm | Photon Energy Threshold Limit |
| External Quantum Efficiency (EQE) | 500 nm – 900 nm | > 90% |
| Spectral Response Peak | 800 nm – 1,000 nm | 0.6 – 0.7 A/W |
| Theoretical Conversion Ceiling | Full Solar Spectrum | 30% |
Theoretical Efficiency Limits and Peak Performance
The efficacy of this absorption process across the solar spectrum is defined by the following characteristics:
- External quantum efficiency (EQE): Measures the percentage of incident photons that successfully produce an electron-hole pair at specific wavelengths, with high-quality silicon achieving over 90% efficiency between 500 nm and 900 nm.
- Spectral response: Represents the current output per watt of light, where silicon reaches its peak performance of roughly 0.6-0.7 A/W within the 800-1,000 nm range.
- Thermalization limit: Dictates that any photon energy beyond the 1.12 eV bandgap is dissipated as heat, restricting single-junction silicon cells to a conversion ceiling of about 29-30%.
Review the spectral response data sheets for your panels to verify how effectively the cells utilize infrared wavelengths near the 1,000 nm limit before installation.
Key factors influencing the practical implementation of silicon-based photovoltaic technology include the following considerations:- Surface recombination velocities at the silicon-metal interface can significantly degrade charge carrier lifetime.
- Anti-reflective coatings are essential to minimize photon reflection, which otherwise prevents light from entering the active semiconductor region.
- Series resistance within the contact grids and the silicon bulk limits the fill factor of the solar cell.
- Temperature coefficients indicate that as operating temperatures rise above standard test conditions, the output voltage drops, further reducing overall energy yield.
Ultraviolet, Visible Light, and Infrared Shares of the Solar Spectrum at Ground Level
Ultraviolet, visible light, and infrared shares of the solar spectrum at ground level represent the distinct energy distribution of radiation that reaches your solar panels after passing through the atmosphere. The solar spectrum arriving at the surface is filtered by gases, water vapor, and aerosols, which shift the intensity of these ranges compared to the solar constant measured outside our atmosphere. Per ASTM International, the standard reference spectrum for terrestrial solar irradiance, known as AM1.5, serves as the approximation for defining this distribution of solar energy across wavelengths for use in performance testing of photovoltaic modules in the United States. You can categorize this distribution into three primary segments based on their wavelength properties:
| Spectral Segment | Wavelength Range (nm) | Energy Contribution (%) | Primary Photovoltaic Impact |
|---|---|---|---|
| Ultraviolet | < 400 | 4% | Minimal current generation; high-energy, low-yield photon absorption |
| Visible Light | 400 – 700 | 43.5% | Peak photon-to-electron conversion efficiency for silicon cells |
| Infrared | > 700 | 51.5% | Dominant thermal energy profile; limited electronic transition potential |
Solar Spectrum Energy Distribution by Range
- Ultraviolet (below 400 nm): This segment accounts for about 3-5% of the total energy in the solar spectrum; while these high-energy photons are present, they provide a very small portion of the potential current for most conventional semiconductor materials.
- Visible light (400 nm to 700 nm): This range comprises about 42-45% of the energy in the solar spectrum, containing the peak intensity around 500 nm that drives the bulk of photon-to-electron conversion in standard silicon cells.
- Infrared (above 700 nm): Representing the largest portion at about 50-53% of the solar spectrum, this long-wavelength radiation dominates the energy profile, though much of it resides at wavelengths that silicon cannot effectively utilize for electricity generation.
Consider the infrared contribution when evaluating thermal management strategies, as this high share of the solar spectrum contributes significantly to cell temperature increases that can reduce your system’s voltage and overall output efficiency.
The following factors influence how these specific spectral segments interact with solar hardware:- Atmospheric Attenuation: Ozone primarily absorbs ultraviolet radiation, while water vapor and carbon dioxide significantly block specific infrared bands.
- Material Bandgaps: Photovoltaic cells can only convert photons with energy levels exceeding the semiconductor’s bandgap, rendering much of the infrared spectrum ineffective for electricity generation.
- Thermal Degradation: Excessive infrared absorption increases module temperature, which paradoxically reduces the voltage output and conversion efficiency of silicon-based solar cells.
- Encapsulant Sensitivity: High-energy ultraviolet radiation can cause long-term chemical degradation or “browning” of the protective polymers used to seal solar modules.
What Percentage of the Solar Spectrum Solar Panels Actually Convert to Electricity
The percentage of the solar spectrum that commercial silicon solar panels convert to electricity typically ranges between 18% and 24% of the total incident energy. While the full solar spectrum available at the surface includes ultraviolet, visible, and infrared light, the internal physics of silicon limits how much of this energy you can capture. Because a single-junction cell cannot efficiently process the wide variety of photon energies present in the solar spectrum, the theoretical Shockley-Queisser limit caps the conversion efficiency of silicon at about 29-30%.
| Spectral Region | Wavelength Range | Primary Conversion Constraint | Energy Capture Outcome |
|---|---|---|---|
| Ultraviolet | < 400 nm | High Thermalization | Excess energy lost as heat |
| Visible | 400–700 nm | Bandgap Alignment | Optimal quantum efficiency |
| Near-Infrared | 700–1,100 nm | Bandgap Energy | Efficient electron excitation |
| Far-Infrared | > 1,100 nm | Sub-Bandgap Energy | Photons pass through uncaptured |
Silicon Solar Conversion Efficiency Limits
Your panel’s output is further constrained by the difference between the photon energy and the semiconductor bandgap. According to the Office of Energy Efficiency and Renewable Energy, photons with energy lower than the bandgap of the semiconductor material pass through the solar cell without being converted into electricity, while photons with excess energy are lost as heat. The following factors illustrate how specific spectral regions influence this conversion process:
- Ultraviolet (under 400 nm): Higher-energy photons experience significant thermalization losses.
- Visible light (400-700 nm): This region provides the most balanced conversion, where high external quantum efficiency (EQE) is typically achieved.
- Infrared (over 700 nm): Photons with wavelengths exceeding roughly 1,100 nm lack the energy to excite electrons across the bandgap and pass through the cell entirely.
- Spectral response: Silicon demonstrates a peak output of approximately 0.6-0.7 A/W when absorbing photons between 800 nm and 1,000 nm.
Compare the spectral response data provided by manufacturers to understand how efficiently your specific model captures infrared wavelengths relative to visible light.
Beyond the intrinsic limitations of the silicon material itself, several external factors further reduce the real-world performance of a solar array:- Temperature coefficients dictate that panel voltage drops as surface heat increases, reducing power yield on hot days.
- Soiling from dust, pollen, or bird droppings physically obstructs light absorption across the panel surface.
- Series resistance in the metal grid lines and interconnects causes resistive power losses as electricity flows out of the cell.
- Optical reflection losses occur at the glass-air interface, even when anti-reflective coatings are applied to the module.
Why Solar Panels Are Rated Under the AM1.5G Reference Spectrum at 1,000 W/m²
Solar panels are rated under the AM1.5G reference spectrum at 1,000 W/m² to ensure that manufacturers use a uniform, repeatable benchmark that mimics the solar spectrum reaching the earth’s surface under typical clear-sky conditions. By standardizing the testing environment to this specific air mass (AM) and intensity, you can compare the performance of different panels fairly, as their output is measured under conditions that account for the filtering effects of the atmosphere.
| STC Parameter | Benchmark Value | Atmospheric/Physical Significance |
|---|---|---|
| Irradiance | 1,000 W/m² | Standardized solar energy flux density reaching the Earth’s surface. |
| Air Mass (AM) | 1.5 | Sunlight path length equivalent to 1.5 atmospheres at a 48.2° incidence angle. |
| Cell Temperature | 25°C | Thermal baseline to mitigate variable voltage and spectral response fluctuations. |
| Spectral Distribution | AM1.5G | Global spectrum accounting for atmospheric scattering and absorption effects. |
Standard Test Conditions Parameters
- Define the air mass (AM) value by calculating the path length of sunlight through the atmosphere; AM1.5 corresponds to sunlight traveling through 1.5 times the thickness of the atmosphere at a 48.2° angle.
- Normalize the solar spectrum intensity to a total power density of 1,000 W/m² to provide a consistent energy input for testing. Per International Electrotechnical Commission, this standard combination of irradiance and spectral distribution serves as the global baseline to allow for the uniform comparison of solar module power ratings across different manufacturers and technologies.
- Apply Standard Test Conditions (STC) by maintaining a controlled cell temperature of 25°C, as the spectral response and voltage characteristics are sensitive to thermal changes.
- Evaluate the module’s electrical output to establish a reliable rating for power capacity under these defined, repeatable conditions.
Always verify the temperature coefficient on a manufacturer’s data sheet to understand how the panel’s actual energy production will deviate from its 25°C rating when the device warms up under direct exposure to the solar spectrum.
To ensure STC compliance, testing laboratories follow these procedural requirements:- Maintain a constant irradiance source using calibrated solar simulators calibrated to the IEC 60904-9 standard.
- Monitor module temperature using sensors attached to the rear surface to ensure the 25°C baseline is strictly maintained during measurement.
- Correct the measured current-voltage (I-V) curves to account for any slight deviations from the 1,000 W/m² irradiance or 25°C temperature setpoints.
- Ensure the spectral irradiance match of the light source adheres to the specific global AM1.5G spectral distribution requirements.
Frequently Asked Questions
What does a solar cell’s spectral response curve show, and where does silicon peak?
A solar cell’s spectral response curve shows current output per watt of light at each wavelength, with silicon peaking at roughly 0.6-0.7 A/W between 800 nm and 1,000 nm. This measure helps you understand how efficiently a specific material converts different parts of the solar spectrum into usable electricity.
Why doesn’t infrared light generate more power in solar panels, and where does the lost spectrum energy go?
Infrared light fails to generate power because silicon has a bandgap of about 1.12 eV, meaning it only absorbs photons with wavelengths below roughly 1,100 nm. Longer wavelengths pass through the cell, while photons with excess energy above the bandgap are lost as heat through a process called thermalization.
How do clouds, haze, and morning or evening light change the spectrum reaching solar panels and their output?
Clouds, haze, and low sun angles shift the incoming solar spectrum, with morning and evening light increasing the air mass (AM) and skewing toward red wavelengths. These shifts cause real-world output to vary by a few percent from values rated under the standardized AM1.5G reference spectrum.
Does ultraviolet light from the solar spectrum damage solar panels over time?
Yes, ultraviolet light from the solar spectrum damages solar panels over time by gradually degrading both the encapsulants and the backsheets. Exposure to this high-energy portion of the spectrum requires you to use durable materials to ensure long-term integrity and performance of your solar panel components.
Do solar panels need the heat from sunlight, or does hotter weather reduce output?
No, solar panels do not need heat; hotter weather actually reduces output by about 0.25-0.4% for each °C above 25°C. While sunlight drives generation, heat acts as a penalty against the efficiency of a solar panel relative to the energy contained within the incident solar spectrum.