
Degradation Rate: Long-term Output, Warranty Terms, First-year Loss, Rate by Technology, Causes, Energy Loss Impact, Measurement Method, Climate Effect, Temporary Losses
Degradation rate is the percentage by which a solar panel’s power output declines over a given period of use. Key aspects include warranty terms, long-term output, rate by technology, first-year loss, energy loss impact, causes, climate effect, measurement method, and temporary losses. Every panel loses a small share of its output as materials age, with the steepest drop usually occurring during the first year of operation. After that, the decline settles into a slower, steadier yearly pace that determines how much electricity your system produces decades from now. Performance warranties put this pattern into writing, and solar panel installers Virginia often cite those guaranteed output levels when describing how a system is expected to perform over time. The figures also differ by cell technology, with monocrystalline, polycrystalline and thin-film panels each showing their own typical range. This article explains first-year loss, warranty terms, long-term output and the rate seen in each technology.
Key Takeaways
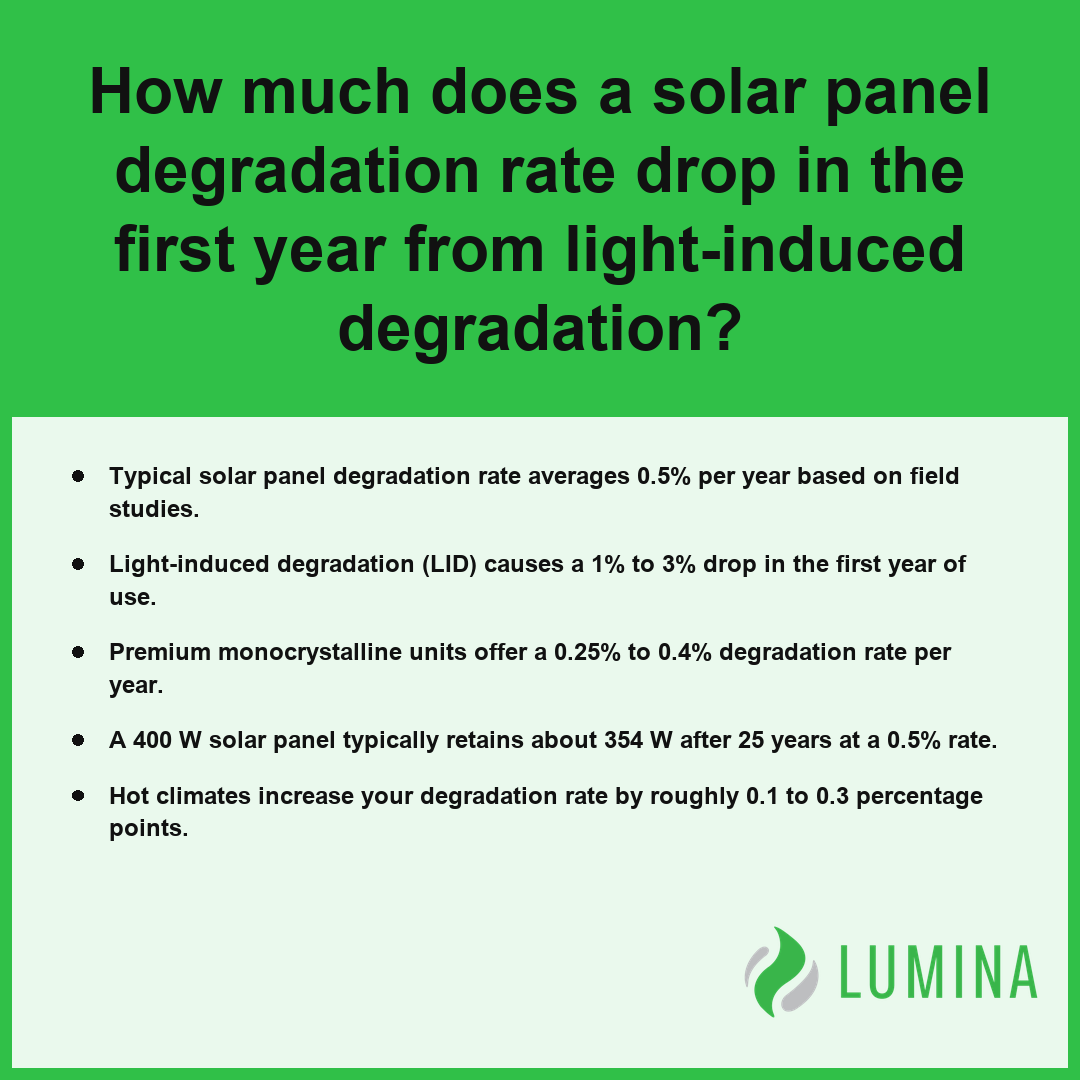
- Typical solar panel degradation rate averages 0.5% per year based on field studies.
- Light-induced degradation (LID) causes a 1% to 3% drop in the first year of use.
- Premium monocrystalline units offer a 0.25% to 0.4% degradation rate per year.
- A 400 W solar panel typically retains about 354 W after 25 years at a 0.5% rate.
- Hot climates increase your degradation rate by roughly 0.1 to 0.3 percentage points.
How Much Does a Solar Panel Degradation Rate Drop in the First Year From Light-Induced Degradation (LID)?
A solar panel degradation rate drops significantly during the first year of operation due to light-induced degradation (LID). Per the National Renewable Energy Laboratory, this phenomenon typically causes a performance drop of approximately 1% to 3% in crystalline silicon solar cells during the initial hours or days of exposure to sunlight. This initial dip occurs as boron-oxygen complexes form within the silicon cells, creating centers that trap electrons and slightly reduce efficiency. While this decrease is more pronounced than the steady annual decline that follows, modern manufacturing techniques—such as the use of n-type silicon—have reduced this impact to under 1% for some premium modules.
| Cell Architecture Type | Expected First-Year LID Loss | Primary Mitigation Factor |
|---|---|---|
| Standard P-type (Boron-doped) | 1.0% – 3.0% | Susceptible to boron-oxygen complex formation |
| N-type Silicon | < 1.0% | Reduced sensitivity to light-induced defects |
| Passivated PERC/TOPCon | 0.5% – 1.5% | Advanced surface defect neutralization |
| Factory Stabilized (Pre-exposed) | < 0.5% | Controlled burn-in during manufacturing |
Estimated First-Year Degradation by Cell Type
You can anticipate that your system will experience this stabilization phase shortly after installation, as the cells react to their new environment. Several factors contribute to the variance in this first-year loss:
- Cell Architecture: P-type boron-doped cells typically experience the higher end of the 1% to 3% range.
- Advanced Passivation: Technologies like PERC or TOPCon help mitigate the chemical reactions that drive LID.
- Manufacturer Quality Control: Some high-end modules undergo a pre-exposure or stabilization process in the factory to burn off the initial LID before the unit is ever delivered to your roof.
Compare the manufacturer’s datasheet against the provided performance warranty to see if they account for this first-year drop separately from the ongoing annual degradation rate.
Several environmental and operational variables can further influence the extent of this initial performance stabilization:- Thermal cycling: Extreme temperature fluctuations during the first weeks can accelerate or alter the stabilization of internal chemical complexes.
- Spectral content: Regions with higher ultraviolet (UV) exposure levels may trigger the completion of the LID process faster than in cloudier climates.
- Installation timing: Systems commissioned during peak summer months often stabilize more rapidly due to the higher intensity of immediate solar irradiance.
- Load conditions: The electrical state of the cells during initial sunlight exposure can influence how rapidly the recombination centers form.
What Is a Good Degradation Rate for Monocrystalline Versus Polycrystalline Solar Panels?
A good degradation rate for monocrystalline solar panels is significantly lower than that of polycrystalline options, as cell purity and manufacturing techniques directly influence long-term stability. While premium monocrystalline modules typically offer a superior degradation rate, older or budget-friendly polycrystalline technology experiences a faster decline in power output over time. Per Lawrence Berkeley National Laboratory, modern standard solar technologies generally show that annual performance losses remain consistent across diverse climate zones in the United States, rarely exceeding 1% per year for residential and commercial systems.
Annual Solar Panel Degradation Rates
| Solar Panel Type | Typical Annual Degradation Rate |
|---|---|
| Premium Monocrystalline | 0.25% to 0.4% per year |
| Industry Average (General) | 0.5% per year |
| Budget or Older Polycrystalline | 0.7% to 1% per year |
The variation in these figures stems from the internal crystalline structure. Monocrystalline cells are cut from a single, high-purity silicon crystal, which minimizes the defects that accelerate electrical loss. Conversely, polycrystalline cells consist of multiple silicon fragments, creating more grain boundaries that can become susceptible to various environmental stresses. When comparing equipment, prioritize manufacturers that provide a linear performance warranty to protect against the higher annual loss typical of lower-tier cell technologies.
Check the product datasheet for the specific crystalline silicon cell architecture to determine if the hardware aligns with your long-term energy production expectations.
Beyond the inherent material quality of the cells, these external variables frequently impact the actual degradation speed of a solar array:- Extreme temperature fluctuations that induce thermal stress and micro-cracking in the cell interconnections.
- High humidity levels that can lead to potential-induced degradation (PID) if the panel’s encapsulation materials are subpar.
- Heavy snow loads or debris buildup that exert mechanical pressure on the glass and silicon layers over time.
- Proximity to coastal environments where salt-mist corrosion can degrade the protective anti-reflective coatings.
How Much Power Your Solar Panels Will Produce After 25 Years at a 0.5% Degradation Rate
If you install a solar panel with a 0.5% degradation rate, you can expect it to produce about 354 W, or 88.6% of its original nameplate output, after 25 years.
| Installation Environment | Annual Degradation Rate | Estimated Power Retention (25 Years) | Final Output (from 400 W Panel) |
|---|---|---|---|
| Standard Climate (Optimal) | 0.5% | 88.6% | 354 W |
| Hot/Low Ventilation (Moderate) | 0.6% | 86.0% | 344 W |
| Hot/Low Ventilation (Extreme) | 0.8% | 81.8% | 327 W |
25-Year Power Retention by Degradation Rate
What a 400 W Solar Panel Delivers Over Time
A 400 W solar panel will produce about 354 W after 25 years when subjected to a 0.5% degradation rate annually. Per the National Renewable Energy Laboratory, at a constant annual degradation rate of 0.5 percent, a solar panel array is expected to retain approximately 88.2 percent of its original nameplate power capacity after 25 years of operation. This calculation accounts for the cumulative effect of performance loss, resulting in approximately 88.6% of the original nameplate output remaining after the quarter-century mark. Because the degradation rate compounds annually, the power decline is not strictly linear, though many manufacturers use linear projections for their performance warranty.
Does Climate Change the Long-Term Numbers?
Yes, climate changes the long-term numbers because heat accelerates the chemical and physical aging processes of solar components. When you install your system in hot climates or on rooftops with limited airflow, you can expect an increased degradation rate of 0.1 to 0.3 percentage points above the standard 0.5% industry average.
Extra Losses on Hot or Poorly Ventilated Rooftops
- Standard climate performance: 0.5% degradation rate per year.
- Hot/unventilated climate performance: 0.6% to 0.8% degradation rate per year.
- Impact on 25-year output: Reduced yield by roughly 2.5% to 7.5% compared to cooler environments.
What the Loss Means for a Home System
For a typical 8 kW home system, a 0.5% degradation rate reduces your annual electricity production by roughly 50 to 55 kWh each year. While this shift may appear minor, the cumulative lost production over 25 years can represent 6% to 12% of your system’s total lifetime energy output compared to a hypothetical scenario with zero decline. Understanding this reduction is essential when you calculate the levelized cost of energy and estimate your expected return on investment.
Review the mounting specifications for your planned array to ensure there is adequate gap space beneath the panels for convective cooling.
Several environmental factors influence how quickly solar panels lose their efficiency over time:- Thermal cycling: Repeated expansion and contraction of panel components due to daily temperature fluctuations can weaken internal electrical connections.
- Humidity and moisture: High-humidity environments can lead to corrosion of the metal contacts and degradation of the encapsulant materials.
- Ultraviolet (UV) exposure: Intense, prolonged UV radiation causes the chemical yellowing of the backsheet and encapsulant, which reduces light transmission to the cells.
- Potential-Induced Degradation (PID): Electrical current leakage caused by high system voltages can lead to a significant drop in power output, particularly in hot and humid climates.
Is a Linear or Step Warranty Better for Solar Panel Degradation Rate Guarantees?
Whether a linear or step warranty is better for your solar panel degradation rate depends on your preference for predictable, steady decline tracking versus guaranteed minimums at major milestones. A linear warranty offers a consistent, annual guarantee of performance loss, typically promising that your equipment will maintain a specific percentage of nameplate output each year following the initial phase. In contrast, a step warranty sets specific power retention benchmarks at fixed intervals, such as year 10 and year 25, which may allow for periods of sharper decline followed by plateaus. Choosing between these structures requires assessing how much transparency you need regarding your system’s output over its multi-decade lifespan.
| Warranty Structure | Year 10 Performance Benchmark | Year 25 Performance Benchmark | Transparency Profile |
|---|---|---|---|
| Linear (Standard) | ~94% to 96% (Calculated) | 87% | High: Continuous annual degradation tracking |
| Linear (Premium) | ~96% to 98% (Calculated) | 92% | High: Predictable year-over-year verification |
| Step | 90% (Fixed) | 80% (Fixed) | Low: Obscures interim degradation rates |
Solar Panel Performance Thresholds at Year 25
- Linear Warranty Predictability: Provides a transparent, year-by-year expectation of output, often guaranteeing 87% to 92% of nameplate output at year 25 to 30. Lawrence Berkeley National Laboratory reports that performance warranties utilizing a linear structure allow for easier verification of degradation rates during periodic monitoring compared to step-based structures, which may obscure gradual efficiency losses between designated trigger points.
- Step Warranty Thresholds: Offers fixed performance promises at set points, such as 90% at year 10 and 80% at year 25, which may obscure the exact degradation rate between those dates.
- Verification Standards: Both warranty types rely on performance measurements taken at standard test conditions (STC) to determine if a claim is valid, ensuring that environmental factors like temporary losses are excluded from the calculation.
- Risk Management: Linear models effectively mitigate the risk of accelerated decay by capping the annual loss percentage, whereas step models ensure the system stays above a baseline requirement regardless of intermittent performance fluctuations.
Review the specific degradation rate schedule in the warranty document to confirm whether the manufacturer promises a constant annual decline or only mandates performance checkpoints at the end of the term.
Consider these practical factors when evaluating which warranty structure best aligns with your long-term energy goals:- Review the degradation claim process to determine if the manufacturer requires third-party performance verification or if they accept remote monitoring data.
- Verify if the warranty covers labor and shipping costs for replacements, as high-percentage benchmarks hold little value if logistical expenses are excluded.
- Check for transferability clauses, as a warranty that remains valid after a home sale significantly enhances the resale value of your property.
- Examine if the warranty covers “power output” only or if it also protects against mechanical defects and premature component failure.
Does a Solar Panel Warranty Cover Degradation, and What Do You Need to File a Claim?
Yes, your performance warranty provides coverage for the solar panel degradation rate, ensuring that your equipment maintains a minimum percentage of its nameplate output over a period of 25 to 30 years. These warranties specifically address the long-term decline in power delivery rather than temporary losses such as soiling or shading, which are considered operational maintenance issues. To successfully file a claim, you must demonstrate that the current power output of your system falls below the guaranteed threshold specified in your documentation when measured at standard test conditions (STC). Per the Department of Energy, these degradation rates are generally tracked by comparing your current electricity production against the panel’s original nameplate capacity under those same standard test conditions.
| Warranty Milestone | Standard Performance Guarantee | Degradation Metric | Verification Condition |
|---|---|---|---|
| Minimum Term | 25 Years | Annual Nominal Decline | Standard Test Conditions (STC) |
| Maximum Term | 30 Years | Nameplate Capacity Baseline | Professional Flash-Test Validation |
Solar Performance Warranty Duration
- Retrieve your original purchase contract and performance warranty certificate to confirm the specific annual degradation rate and minimum output guarantees for your hardware.
- Perform a visual inspection to ensure that reduced power is not caused by external factors like debris, shading, or physical damage that would void a warranty claim.
- Contact your installer to request a performance report, as they must often use calibrated flash-test equipment or professional monitoring software to verify that the output is indeed lower than the guaranteed nameplate output.
- Submit a formal claim including your system serial numbers, the installation date, and the recorded performance data showing that the degradation rate has exceeded the warrantied limits.
- Await a site inspection or an analysis of your system monitoring logs, which the manufacturer will use to validate that the output drop is internal to the cells rather than an inverter or wiring failure.
Review your monitoring software logs monthly to identify sudden drops in energy production that deviate from your predicted annual degradation rate.
Follow these steps to investigate potential performance discrepancies before initiating a formal warranty claim:- Cross-reference your inverter monitoring data with local weather logs to rule out anomalous environmental events.
- Clean the panel surfaces according to manufacturer specifications to eliminate artificial output drops caused by debris.
- Contact a certified solar technician to perform a professional IV-curve trace, which is often required for valid warranty evidence.
- Document the serial numbers of individual panels suspected of underperforming to streamline the manufacturer’s diagnostic process.
Frequently Asked Questions
What causes solar panel degradation rate to increase over time?
Solar panel degradation rate increases over time due to factors such as light-induced degradation (LID), potential-induced degradation (PID), thermal cycling, and UV exposure. Additional physical stressors include moisture ingress, delamination, microcracks, solder bond fatigue, and encapsulant browning, which collectively contribute to the gradual loss of power output as your solar panel ages.
Do solar panels degrade faster in hot climates or on rooftops with poor airflow?
Yes, solar panels degrade faster in hot climates and on rooftops with poor airflow, typically showing a degradation rate that is 0.1 to 0.3 percentage points higher than in cool climates. Heat accelerates the chemical and physical aging processes within the components, leading to a more rapid decline in performance.
How many kWh will my home solar system lose each year to degradation rate?
Your home solar system will lose about 50 to 55 kWh each year to a 0.5% degradation rate, assuming a typical 8 kW system producing 10,000 to 11,000 kWh annually. Over 25 years, this cumulative loss represents about 6% to 12% of your lifetime energy production compared with zero degradation.
How is solar panel degradation rate measured and how can I check my own panels?
Solar panel degradation rate is measured by comparing field or flash-test power at standard test conditions (STC)—defined as 1000 W/m² irradiance, 25°C cell temperature, and AM1.5 spectrum—against the original nameplate output. You can assess your system by comparing current monitored output against these initial specifications while accounting for environmental variables.
Is a drop in my solar output permanent degradation or just soiling, shade, or snow?
A drop in solar output is often due to temporary losses like soiling, shading, snow, or inverter clipping, rather than permanent degradation. Unlike the chemical aging processes that define the long-term degradation rate, these external factors are reversible and do not indicate a permanent decline in the efficiency of your solar panel.