
Environmental Issues: Payback Time, Carbon Footprint, Manufacturing Impact, Recycling, Disposal Rules, Hazardous Materials, Land Use, Avoided Emissions, Water Use, Wildlife Effects
Environmental issues are the effects of a technology on air, water, land, and living systems across its entire life. Key aspects include carbon footprint, payback time, recycling, manufacturing impact, hazardous materials, disposal rules, avoided emissions, land use, wildlife effects, and water use. For solar panels, these effects arise during mining, manufacturing, transport, operation, and disposal. Your panels produce electricity without burning fuel, but making them uses energy and raw materials such as silicon, glass, aluminum, and silver. In a region with growing solar energy Pennsylvania has its own mix of grid emissions, climate, and sunlight that shapes how quickly a system offsets its production impact. The article explains carbon footprint, payback time, manufacturing impact, hazardous materials, and recycling, each as a stage in the panel life cycle.
Key Takeaways
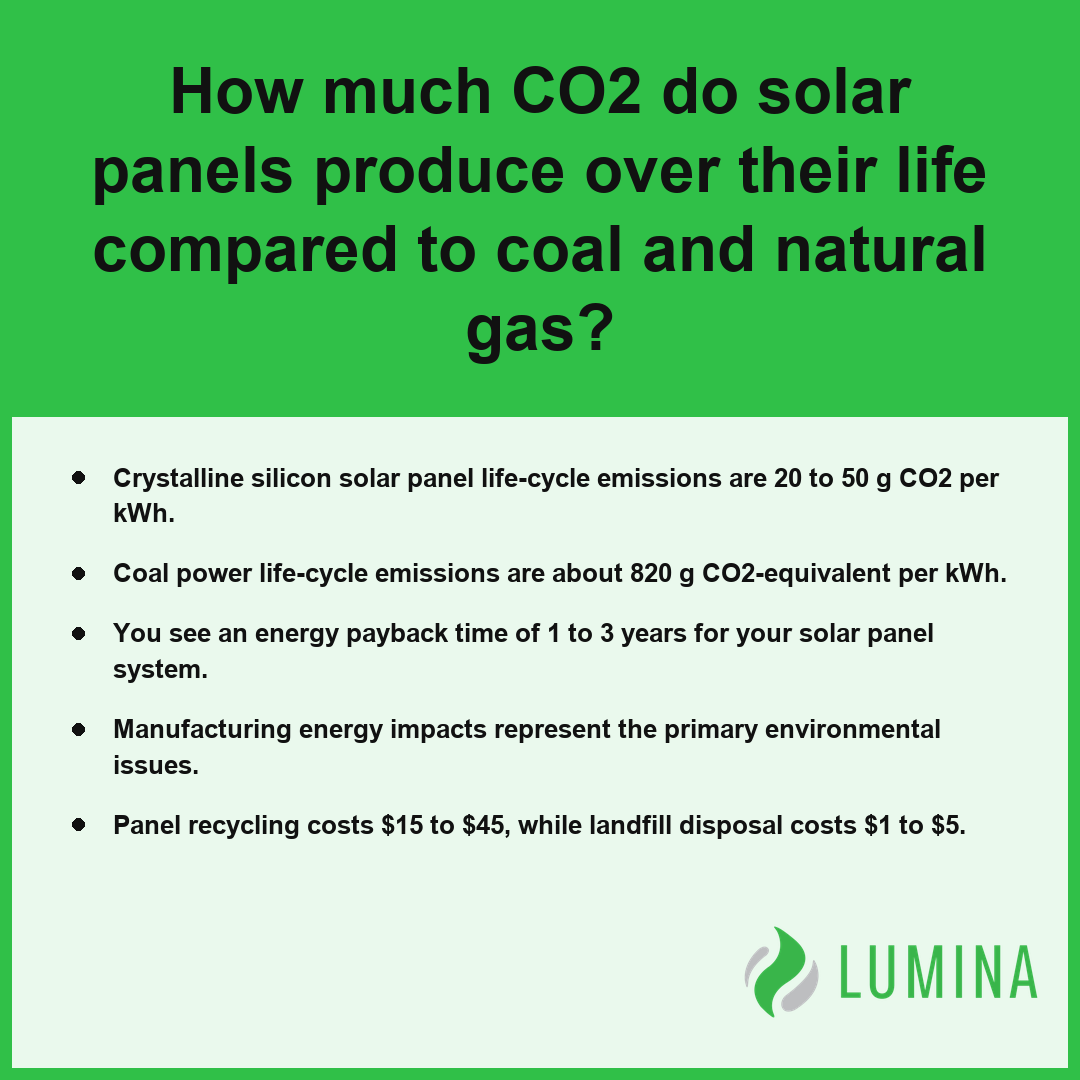
- Crystalline silicon solar panel life-cycle emissions are 20 to 50 g CO2 per kWh.
- Coal power life-cycle emissions are about 820 g CO2-equivalent per kWh.
- You see an energy payback time of 1 to 3 years for your solar panel system.
- Manufacturing energy impacts represent the primary environmental issues.
- Panel recycling costs $15 to $45, while landfill disposal costs $1 to $5.
How Much CO2 Do Solar Panels Produce Over Their Life Compared to Coal and Natural Gas?
You will find that the life-cycle emissions for crystalline silicon solar panels, which range from roughly 20 to 50 g CO2-equivalent per kWh, are significantly lower than those for coal power at about 820 g CO2-equivalent per kWh, thereby addressing major environmental issues associated with traditional energy sources.
Life-Cycle CO2 Emissions (g CO2-e/kWh)
Life-Cycle Emissions of Crystalline Silicon Solar Panels
Crystalline silicon solar panels produce significantly less CO2 over their life compared to coal and natural gas because their life-cycle emissions range only from roughly 20 to 50 g CO2-equivalent per kWh. Per the National Renewable Energy Laboratory, life-cycle analysis shows that solar photovoltaic systems typically produce between 20 and 50 grams of carbon dioxide equivalent per kilowatt-hour of electricity generated, whereas coal-fired power plants produce roughly 1,000 grams per kilowatt-hour. While these figures encompass the environmental issues inherent in extracting raw materials and the high-heat manufacturing required to purify polysilicon, they remain a fraction of the climate impact associated with burning fossil fuels for electricity.
What Drives the Range Between 20 and 50 g CO2-Equivalent per kWh?
The variation in this range primarily depends on the energy source used for manufacturing, as purifying polysilicon consumes roughly 100 to 150 kWh per kg. Factories powered by grids with high shares of renewable energy result in emissions at the lower end of the spectrum, while those relying on coal-heavy grids move the footprint toward the higher end.
How Coal and Natural Gas Compare
To understand the environmental issues of power generation, you can compare the life-cycle carbon intensity of different energy sources in the table below:
| Energy Source | Life-Cycle Emissions (g CO2-equivalent/kWh) |
|---|---|
| Coal power | About 820 |
| Natural gas (combined cycle) | About 490 |
| Crystalline silicon solar panels | Roughly 20 to 50 |
Why Avoided Emissions Grow Over a 25-Year Service Life?
A typical solar panel service life spans 25 to 30+ years, during which your installation generates clean energy that displaces grid power generated by fossil fuels. Because the initial carbon debt is paid off quickly, the total amount of avoided emissions accumulates significantly over time. Even with an annual output degradation of about 0.5% per year, the cumulative environmental benefits far outweigh the initial production footprint.
Compare the carbon intensity of your local utility grid against these standardized values to determine the specific timeframe required for your installation to achieve a net-positive climate impact.
Several key factors influence where a specific solar panel production facility falls within the 20 to 50 g CO2-equivalent range:- Manufacturing Location: Facilities situated in regions with a high percentage of carbon-neutral grid electricity significantly reduce the carbon intensity of energy-intensive polysilicon purification.
- Supply Chain Efficiency: The proximity of raw material extraction to manufacturing plants reduces the carbon footprint associated with global transportation and logistics.
- Technological Advancements: Continuous improvements in wafer-thinning techniques and chemical vapor deposition efficiency reduce the total raw material requirements and energy consumption per unit.
- Recycling and Circularity: The integration of recycled silicon and aluminum into the production process lowers the emissions typically associated with virgin material extraction and refinement.
How Long It Takes a Solar Panel to Pay Back the Energy Used to Make It
The energy payback time for a solar panel is the period required for it to generate an amount of electricity equivalent to the energy consumed during its production, which typically ranges from 1 to 3 years for rooftop systems. According to Argonne National Laboratory, life cycle assessments confirm that the energy investment needed for silicon-based modules is recouped within a small fraction of the equipment’s total expected lifespan. This duration accounts for the total environmental issues embedded in the supply chain, including the energy-intensive purification of polysilicon, which requires roughly 100 to 150 kWh per kilogram in modern manufacturing processes. Once the solar panel reaches this threshold, every subsequent kilowatt-hour produced offsets the initial energy debt, contributing to a net reduction in overall resource consumption over a typical 25 to 30+ year service life.
| Metric | Primary Range | Contextual Factors |
|---|---|---|
| Energy Payback Period | 1 – 3 Years | Based on 25–30+ year total service lifespan |
| Manufacturing Energy Cost | 100 – 150 kWh / kg Si | Incurs for polysilicon purification process |
| Conversion Efficiency | 20% – 24% | Monocrystalline performance vs. polycrystalline |
| Operational Influencers | Irradiance & Grid Mix | Site-specific solar resource and factory energy source |
Typical Energy Payback Time (Years)
Several variables influence how quickly you recover the manufacturing energy investment:
- Grid Carbon Intensity: The environmental issues associated with your system are lower if the factory relies on a renewable-heavy power grid rather than fossil fuels.
- System Efficiency: Higher efficiency monocrystalline modules (20-24%) produce more energy per square foot than older polycrystalline designs, shortening the payback window.
- Irradiance Levels: The local solar resource directly dictates how many kilowatt-hours your specific photovoltaic (PV) module generates, impacting the net energy balance.
- Manufacturing Location: Technologies and process heat sources vary by region, altering the total energy footprint of the raw materials used.
Calculate your expected annual solar yield based on local site shading to verify if your specific installation hits the lower end of the energy payback range.
Several factors influence the actual energy payback time for solar installations beyond the base manufacturing metrics:- Geographic latitude and local solar irradiance levels directly determine the total electricity yield per square meter.
- System mounting orientation and tilt angle optimize annual solar energy capture compared to theoretical maximums.
- The carbon intensity of the regional electrical grid used during panel manufacturing alters the initial energy debt.
- Technological advancements in wafer thinning and kerf-loss reduction continue to lower the energy input required per panel.
- Regular maintenance and inverter health ensure sustained energy production throughout the module’s multi-decade service life.
Why Where Solar Panels Are Manufactured Changes Their Environmental Issues
Where your solar panels are manufactured changes their environmental issues because the production process is highly energy-intensive, and the carbon footprint of your equipment depends directly on the energy source of the factory grid. Polysilicon purification is the most resource-heavy step, requiring roughly 100 to 150 kWh per kg of material, meaning that a solar panel produced in a region relying on coal-heavy electricity carries a much higher initial carbon debt than one manufactured in a region utilizing renewable energy sources. Per the Department of Energy, the lifecycle greenhouse gas emissions of solar panels are influenced by the regional electricity grid mix used during the energy-intensive silicon purification and module assembly phases.
| Manufacturing Impact Factor | Primary Environmental Driver | Emission Intensity Variable |
|---|---|---|
| Polysilicon Purification | High-heat electricity demand (100-150 kWh/kg) | Regional grid carbon intensity (Coal vs. Renewables) |
| Component Material Weight | Logistical shipping distance of glass and aluminum | Total transit fuel consumption per installation |
| Raw Material Extraction | Industrial refining of silver and aluminum | Regulatory stringency of local air/water standards |
| Module Assembly | Factory-level energy sourcing | Supply chain transparency and site-specific energy mix |
- Energy Source: Facilities powered by coal-based grids result in higher life-cycle emissions compared to those using wind, hydro, or solar electricity.
- Supply Chain Transparency: Tracking the manufacturing origin helps you understand the hidden industrial footprint of your system before it even reaches your property.
- Industrial Regulation: Stringent local air and water quality standards at production sites influence the total environmental issues associated with the extraction and refining of raw materials like silver and aluminum.
- Transport Distance: Shipping heavy materials, such as the glass and aluminum that comprise 75-80% of a typical module’s weight, adds a secondary layer of emissions based on the distance between the factory and the final installation site.
Investigate the manufacturing origin of your specific photovoltaic (PV) module model to determine if the producer utilizes low-carbon energy sources or maintains high-efficiency supply chain standards.
Reducing the total environmental impact of solar procurement involves several strategic considerations beyond manufacturing location:- Prioritize manufacturers that utilize third-party environmental audits, such as the Silicon Valley Toxics Coalition, to verify supply chain sustainability.
- Select modules designed with modular architecture, which significantly improves reparability and extends the functional lifespan of the equipment.
- Evaluate the manufacturer’s end-of-life recycling program to ensure that high-value materials like silver and silicon are recovered rather than landfilled.
- Review the company’s commitment to “green manufacturing” certifications, such as ISO 14001, which mandates systematic reduction of waste and energy consumption at the factory level.
Do Solar Panels Contain Lead, Cadmium, or Other Toxic Materials, and Do They Leak in Normal Use?
Solar panels do contain trace amounts of heavy metals, but these substances are encapsulated within the hardware and do not leak during normal operation, meaning they pose minimal environmental issues while the photovoltaic (PV) module remains intact. According to Brookhaven National Laboratory, solar photovoltaic panels do not pose a risk of toxic leakage to groundwater or soil during their operational lifespan because the active materials are physically sequestered behind protective layers. Materials such as lead, often found in solder, and cadmium, which is a component in cadmium telluride (CdTe) thin-film, are locked into the solid state of the device. Because the glass and polymer backsheet provide a weather-resistant barrier, the components remain contained throughout the panel’s standard service life of 25 to 30+ years.
| Material Component | Primary Function in PV Module | Status During Operation | Relative Weight (%) |
|---|---|---|---|
| Aluminum and Glass | Structural casing and weather-resistant barrier | Inert and stable | 80% |
| Lead | Solder for electrical connectivity | Sequestered in solid state | <1% |
| Cadmium | Semiconductor in thin-film cells | Encapsulated/Sealed | <1% |
| Silver | Conductive paste for power collection | Integrated into cell structure | <1% |
| Other Components | Backsheets, polymers, and internal circuitry | Contained within device architecture | ~19% |
Composition of Solar PV Module Weight (%)
- Lead: Historically utilized in the solder joints of crystalline silicon panels; typically present in quantities of only a few grams per unit.
- Cadmium: Used as a primary semiconductor material in cadmium telluride (CdTe) thin-film modules; completely sealed to prevent environmental exposure.
- Silver: Employed in conductive pastes for electrical collection; while not classified as toxic in the same manner as heavy metals, it represents a valuable raw material integrated into the cell structure.
- Aluminum and Glass: Comprising 75-80% of a module’s total weight, these inert materials form the protective casing that prevents internal degradation and material leaching.
Research the end-of-life handling requirements for your specific hardware model to understand how your local area regulates the disposal of electronics containing these encapsulated materials.
The following safety practices help maintain the integrity of solar panels throughout their operational lifespan:- Perform routine visual inspections to identify signs of physical damage, such as cracks or broken seals, that could compromise encapsulation.
- Ensure panels are professionally installed to prevent structural stress that may lead to the degradation of protective layers.
- Avoid the use of harsh chemical cleaning agents that could potentially react with the panel’s weather-resistant polymer backsheet.
- Consult with licensed recycling programs at the end of the service life to ensure proper handling and recovery of heavy metal components.
Can Solar Panels Be Recycled, and Why Does Panel Recycling Cost More Than Landfill Disposal?
Yes, solar panels can be recycled, though this process currently faces significant economic hurdles compared to landfill disposal when addressing persistent environmental issues. Because a typical photovoltaic (PV) module weighs 40 to 50 lb (18 to 23 kg) and is composed primarily of glass, aluminum, and silicon, specialized facilities are required to separate these materials effectively. Per the Environmental Protection Agency, solar panels are largely composed of glass, aluminum, and small amounts of semiconductor materials that can be recovered through specialized mechanical and chemical recycling processes.
Average Disposal Cost per Solar Panel
| Disposal Method | Estimated Cost per Panel |
|---|---|
| Panel recycling | $15 to $45 |
| Landfill disposal | $1 to $5 |
The disparity between these costs exists because recycling involves labor-intensive mechanical separation and chemical processing to reclaim high-value materials like silver and refined silicon, whereas landfilling serves as a low-cost, immediate solution. While there is no federal ban on landfilling, some regions categorize discarded photovoltaic (PV) modules as universal waste to mitigate long-term environmental issues. As millions of tonnes of panels reach the end of their service life, the logistical challenge of transporting bulky modules to limited recycling centers continues to outweigh the immediate financial incentive for recovery. Research local waste management mandates to determine if your discarded photovoltaic (PV) modules must be diverted from standard trash streams to certified collection centers.
To identify the best end-of-life options for your solar panels, consider these additional factors:- Check with the original manufacturer, as many companies offer voluntary take-back or trade-in programs for their modules.
- Search the SEIA (Solar Energy Industries Association) national recycling database to locate certified facilities within your state.
- Consult with your local installer, who may provide decommissioning services or have established relationships with specialized recycling partners.
- Verify if your municipal waste department requires a hazardous waste permit for PV disposal, even if landfilling is technically permitted.
Frequently Asked Questions
Is it legal to throw old solar panels in the landfill, or are they treated as hazardous waste?
No, it is not always illegal to throw old solar panels in a landfill, though regulations vary by jurisdiction. While some areas classify them as universal waste, many locations lack federal bans on landfill disposal. Recycling costs roughly $15 to $45 per panel, often making landfill disposal cheaper at $1 to $5.
How much land does a utility-scale solar farm need compared with rooftop solar panels?
Utility-scale solar requires about 5 to 10 acres per megawatt of AC capacity, whereas rooftop solar panels use no new land. By installing on existing structures, you avoid the land-use requirements of large projects, which is a major benefit when considering the footprint of your energy generation system.
Do solar farms harm wildlife and soil, and can agrivoltaics or pollinator habitat reduce the damage?
Solar farms can impact wildlife and soil, but dual-use designs like agrivoltaics and pollinator-friendly ground cover effectively reduce this damage. These systems integrate agricultural practices or natural habitats directly into the project site, allowing you to produce energy while maintaining soil health and providing essential support for local wildlife species.
How much water do solar panels use compared with thermal power plants?
Solar panels use very little water during operation, far below the usage of thermal power plants that require hundreds of gallons per megawatt-hour. Your solar system needs only occasional cleaning to maintain performance, making it a highly water-efficient energy choice that helps conserve vital local resources during its lifespan.
How many tons of CO2 does a 7 kW home solar system avoid each year as the panels degrade?
A 7 kW home system avoids approximately 4 to 6 metric tons of CO2 annually depending on the displaced energy source, accounting for an annual output degradation of about 0.5% per year. These avoided emissions help mitigate environmental issues, ensuring your system remains a positive force for the climate for decades.