
Greenhouse Gas Emissions: Lifecycle Intensity, Annual Avoided Amount, Grid Emission Factor, Carbon Payback Time, Manufacturing and Disposal, Sources by Sector, Atmospheric Effects, Co2e Measurement, Emission Scopes
Greenhouse gas emissions are releases of gases such as carbon dioxide and methane that trap heat in the atmosphere. Key aspects include annual avoided amount, lifecycle intensity, carbon payback time, grid emission factor, sources by sector, manufacturing and disposal, co2e measurement, atmospheric effects, and emission scopes. Solar panels produce electricity without burning fuel, so their emissions come mainly from manufacturing, transport and installation rather than from operation. The amount you avoid each year depends on how much electricity the panels generate and on the grid emission factor, which measures the greenhouse gases released per unit of power from the local grid. For solar power Pennsylvania, that factor reflects a mix of natural gas, nuclear, coal and renewables, which shapes how much carbon each kilowatt-hour displaced actually saves. Lifecycle intensity spreads the emissions from making and disposing of the panels across the energy they deliver, and carbon payback time shows how long a system takes to offset its own production emissions. This article explains each of these measures and how they fit together.
Key Takeaways
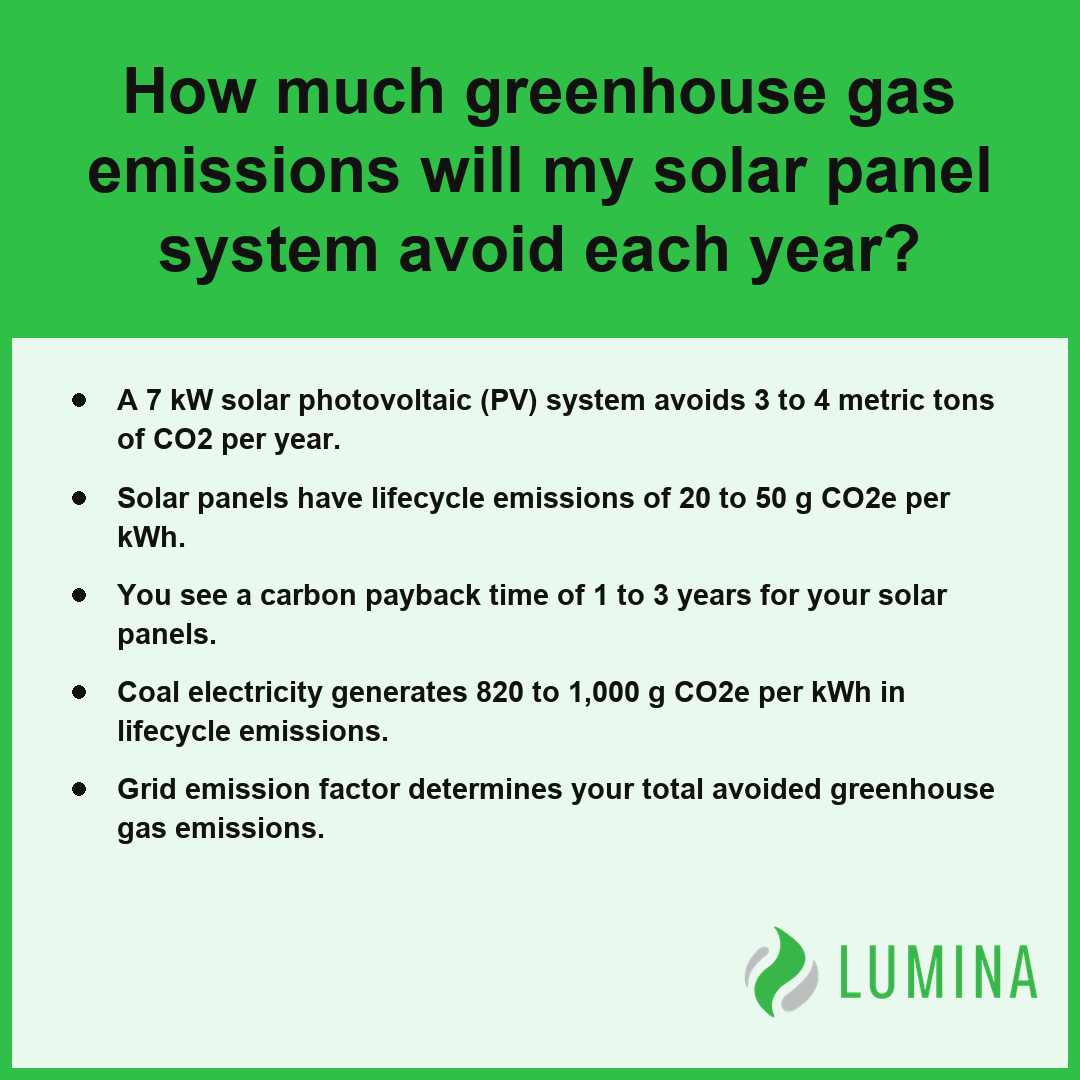
- A 7 kW solar photovoltaic (PV) system avoids 3 to 4 metric tons of CO2 per year.
- Solar panels have lifecycle emissions of 20 to 50 g CO2e per kWh.
- You see a carbon payback time of 1 to 3 years for your solar panels.
- Coal electricity generates 820 to 1,000 g CO2e per kWh in lifecycle emissions.
- Grid emission factor determines your total avoided greenhouse gas emissions.
How Much Greenhouse Gas Emissions Will Your Solar Panels Avoid Each Year?
A typical 7 kW residential solar photovoltaic (PV) system will avoid roughly 3 to 4 metric tons of CO2 in greenhouse gas emissions each year. This calculation assumes the system produces between 8,000 and 10,000 kWh annually, replacing electricity that would have otherwise been generated by the grid. Because solar panels produce electricity without direct fuel combustion, the total volume of avoided greenhouse gas emissions is primarily a result of the volume of electricity generated multiplied by the regional grid emission factor. Per the Department of Energy, the greenhouse gas mitigation potential of a solar array is an approximation that depends on the emissions intensity of the local utility grid, as residential systems offset the specific energy mix used to power homes in that region.
| System Capacity (kW) | Annual Generation Estimate (kWh) | Annual CO2 Avoidance (Metric Tons) | 25-Year Cumulative Impact (Metric Tons) |
|---|---|---|---|
| 7 kW (Lower Bound) | 8,000 | 3.0 | 75.0 |
| 7 kW (Upper Bound) | 10,000 | 4.0 | 100.0 |
| Note: Cumulative impact assumes a 25-year operational lifespan and consistent annual emissions offset. | |||
Estimated Annual CO2 Avoidance (Metric Tons)
To understand the potential impact of your system, consider these factors that influence the total annual avoidance:
- System size: A higher kW rating generally leads to increased annual energy production and higher total avoided emissions.
- Annual energy generation: Solar output depends on panel orientation, tilt, and local solar resource availability.
- Grid emission factor: The intensity of the local grid determines the greenhouse gas emissions intensity of the electricity being displaced.
- Operational life: Over a system lifespan of 25 to 30 years or more, these annual savings aggregate significantly.
Compare the anticipated annual energy output of your specific site plan against the local grid emission factor to refine your estimate of annual avoided emissions.
Several external variables beyond system capacity affect the actual environmental performance of your installation:- Solar Insolation: Geographical location determines the average daily peak sun hours received by the panels.
- Panel Orientation and Tilt: Aligning arrays toward the equator and optimizing the tilt angle maximizes annual energy harvest.
- System Degradation: Photovoltaic efficiency naturally declines by a small percentage annually, which slightly reduces long-term output.
- Maintenance and Cleaning: Accumulations of dust, snow, or debris can obstruct sunlight and decrease the effective conversion rate.
- Grid Carbon Intensity: Transitions in the regional utility energy mix toward renewables may decrease the relative impact of each offset kilowatt-hour over time.
Why the Grid Emission Factor Changes Your Avoided Emissions
Because the grid emission factor determines how many greenhouse gas emissions are displaced for every kilowatt-hour generated by your solar photovoltaic (PV) system, fluctuations in the regional power mix directly alter your calculated avoided emissions.
CO2 Emission Intensity by Grid Type (kg CO2/kWh)
How Regional Grid Mix Shifts the Result
The grid emission factor changes your avoided emissions because it determines the specific amount of greenhouse gas emissions displaced for every kilowatt-hour your solar photovoltaic (PV) system generates. Because the electricity grid functions as a unified network, the fuel sources feeding that network dictate the intensity of the displaced generation. When you produce solar energy, you replace the marginal power source that would have otherwise met the demand, directly preventing the greenhouse gas emissions associated with that generation method.
Coal-Heavy Grids Versus Low-Carbon Grids
| Grid Type | Estimated Emission Intensity |
|---|---|
| Hydro-rich or low-carbon grids | Under 0.1 kg CO2 per kWh |
| Average U.S. grid | About 0.37 kg CO2 per kWh |
| Coal-heavy grids | Above 0.6 kg CO2 per kWh |
Does Your Local Grid Change the Avoided Emissions From Your Solar Panels?
Yes, your local grid changes the avoided emissions from your solar panels by acting as the specific baseline against which your performance is measured. According to the Energy Information Administration, because the U.S. grid consists of regional interconnections with varying proportions of coal, natural gas, and renewables, the carbon intensity of displaced grid electricity differs significantly by state and utility territory. Because electricity generation accounts for about 25% of all greenhouse gas emissions, regional reliance on fossil fuels versus renewable sources creates wide variations in potential environmental impact. A system producing 10,000 kWh per year avoids significantly more greenhouse gas emissions in a region dependent on coal than it would in an area utilizing nuclear or hydroelectric power.
Where to Find Your Grid Emission Factor
You can identify the grid emission factor for your area by reviewing regional energy data published by national environmental or statistical agencies. These reports typically aggregate the annual fuel mix—identifying the percentages of coal, natural gas, wind, and solar feeding your specific interconnect—to provide a localized metric for your environmental impact calculations.
Verify your region’s current energy mix profile through public reports to determine if your area is transitioning toward a lower emission factor. Several external factors influence the specific grid emission factor applied to your solar energy production:- Marginal Emission Rate: Avoided emissions are often calculated based on the specific power plant currently serving the grid’s most immediate incremental demand, rather than the average system-wide emission intensity.
- Time-of-Use Variations: Grid emission intensity typically fluctuates throughout the day, often peaking during high-demand periods when less efficient, carbon-intensive “peaker” plants are activated.
- Interconnectivity and Imports: The regional power mix can be altered by imported electricity from neighboring states or regions, which may have vastly different generation profiles than your local utility.
- Transmission Losses: The distance electricity travels from the generation source to your location can lead to energy loss, requiring more generation at the source to meet your specific load requirements.
Lifecycle Greenhouse Gas Emissions of Solar Panels Compared With Coal, Natural Gas, and Wind
Lifecycle greenhouse gas emissions of solar panels are significantly lower than those of fossil fuel-based generation, reflecting the minimal impact of solar energy compared to traditional sources. While all energy technologies produce some level of embodied emissions during their creation, solar photovoltaic (PV) systems represent a low-carbon alternative to coal and natural gas by producing electricity without burning fuels.
Lifecycle Greenhouse Gas Emissions (g CO2e per kWh)
| Technology | Lifecycle Greenhouse Gas Emissions (g CO2e per kWh) |
|---|---|
| Coal | 820 to 1,000 |
| Natural Gas | 400 to 500 |
| Solar Photovoltaic (PV) System | 20 to 50 |
| Wind | 10 to 15 |
The vast majority of solar lifecycle emissions occur during the manufacturing phase, particularly in the energy-intensive processes required to mine, refine, and purify silicon. Conversely, fossil fuel sources continue to generate greenhouse gas emissions throughout their entire operational life as fuel is extracted and burned. Per the National Renewable Energy Laboratory, lifecycle greenhouse gas emissions for solar photovoltaics typically range from approximately 0.04 to 0.06 pounds of carbon dioxide equivalent per kilowatt-hour, which is significantly lower than the roughly 2.2 pounds produced by coal and 0.9 pounds by natural gas. Although wind energy holds the lowest lifecycle profile, solar photovoltaic (PV) systems remain a highly effective tool for reducing grid-wide intensity. When evaluating your potential impact, compare the specific lifecycle data of different panel materials, such as thin-film versus crystalline silicon, to understand how manufacturing variations might influence the total embodied emissions of your installation.
The following factors contribute to the variation in lifecycle emissions across different solar energy installations:- Manufacturing geography, specifically the carbon intensity of the electrical grid used in the region where panels are produced.
- Panel efficiency and degradation rates, which dictate how much total energy is generated over the system’s lifespan.
- Type of mounting system, such as ground-mounted arrays versus rooftop installations, due to differing structural material requirements.
- End-of-life management, including the efficiency of recycling processes for recovering glass, aluminum, and silicon.
How Long Solar Panels Take to Pay Back the Greenhouse Gas Emissions From Making Them
The carbon payback time for solar panels is the period, typically ranging from 1 to 3 years, that a solar photovoltaic (PV) system must operate to offset the embodied emissions generated during its manufacturing, transport, and installation. Per Argonne National Laboratory, life cycle assessments confirm that the energy and emissions invested in silicon-based solar panel production are generally offset by emission-free generation within one to three years, depending on the installation site and module efficiency. Because the production of solar components—such as mining silicon and the energy-intensive process of cell manufacturing—results in initial greenhouse gas emissions, your system begins its operational life with a small environmental debt. Once the system is active, the electricity it generates displaces power that would have otherwise been supplied by the grid, effectively paying back those manufacturing emissions through avoided emissions over time.
| Project Lifecycle Phase | Duration (Years) | Environmental Impact Status |
|---|---|---|
| Manufacturing & Installation | 0 | Incurring Initial Carbon Debt |
| Carbon Payback Period | 1 – 3 | Offsetting Embodied Emissions |
| Operational Generation | 3 – 30 | Net Carbon Avoidance |
Carbon Payback and Operational Lifespan (Years)
Factors influencing how quickly your specific system reaches this threshold include the following:
- The carbon intensity of the electricity used at the manufacturing plant where your solar panels were produced.
- The total amount of solar energy your system generates based on local irradiance levels and tilt orientation.
- The efficiency of the panel technology, which dictates how many resources are required to produce each watt of capacity.
- The operational lifespan of your system, which generally extends to 25 to 30 years or more, ensuring long-term net reductions.
Evaluate the manufacturer’s provided lifecycle assessment data to determine the specific carbon intensity of the model you intend to purchase.
Several technical and environmental variables determine how quickly your solar array reaches its carbon neutrality milestone:- Geographic Irradiance: Locations with higher annual solar insolation generate more electricity per panel, accelerating the payback period.
- Grid Carbon Intensity: Systems installed in regions reliant on coal or fossil fuels displace “dirtier” energy, resulting in a faster relative offset of carbon debt.
- Manufacturing Methodology: Use of renewable energy in the factory supply chain during the fabrication of wafers and modules reduces the initial embodied carbon debt.
- System Efficiency: High-efficiency modules maximize energy harvest from the same footprint, shortening the time required to meet the break-even energy threshold.
Will Solar Panels Avoid Fewer Greenhouse Gas Emissions as the Grid Gets Cleaner?
Yes, solar panels will avoid fewer greenhouse gas emissions as the grid gets cleaner because the relative environmental advantage of switching from grid-supplied electricity to self-generated solar power decreases as the overall system decarbonizes. When your local grid relies heavily on fossil fuels, every kilowatt-hour generated by your solar photovoltaic (PV) system displaces high-intensity generation sources like coal or natural gas. As the electricity sector transitions toward wind, solar, and other low-carbon technologies, the average grid emission factor drops, meaning the marginal benefit of each kilowatt-hour produced by your system technically offsets less pollution than it does on a dirtier grid. Per the Environmental Protection Agency, as the national electricity grid incorporates more low-carbon energy sources, the marginal emissions benefit of adding new solar capacity decreases because the displaced generation is already cleaner.
| Grid Decarbonization Stage | Displacement Target | Relative Emissions Offset Potential |
|---|---|---|
| Carbon-Intensive (Coal/Gas Dependent) | High-Emissions Baseload Plants | Maximum Marginal Benefit |
| Transitioning (Hybrid Renewable Mix) | Intermediate Peaker Plants | Moderate Marginal Benefit |
| Deep Decarbonization (Renewable-Dominant) | Flexible Low-Carbon Reserves | Diminishing Marginal Benefit |
Solar Panel Lifespan Estimates (Years)
Despite this reduction in the annual avoided emissions metric, the transition provides a systemic benefit to the climate. Your investment continues to contribute to the reduction of total greenhouse gas emissions by facilitating the broader retirement of fossil fuel assets. The following factors influence how your system interacts with a cleaner grid:
- The speed of regional grid decarbonization relative to the expected 25 to 30 years or more lifespan of your solar panels.
- The operational flexibility of your solar photovoltaic (PV) system when integrated with storage to match peak grid demand.
- The lifecycle emissions intensity of future grid additions compared to your installed technology.
Evaluate your local utility’s integrated resource plan to see if they have established a timeline for retiring coal-fired generation assets in your region.
Beyond the emission displacement factors, homeowners should consider these practical strategies to maximize the long-term environmental value of a solar installation:- Optimize panel orientation and tilt to ensure peak energy production throughout the system’s entire lifecycle.
- Integrate smart energy storage to shift self-consumption patterns, reducing reliance on the grid during high-demand periods.
- Implement regular maintenance schedules, such as cleaning and inverter inspections, to prevent performance degradation over time.
- Electrify household appliances, such as heating and water systems, to ensure your generated power directly displaces fossil fuel combustion rather than just grid-level electricity.
Frequently Asked Questions
How are greenhouse gas emissions measured in CO2-equivalent, and why does methane count more than carbon dioxide?
Greenhouse gas emissions are measured in CO2e (carbon dioxide equivalent) by applying the global warming potential (GWP) of each gas over 100 years. While CO2 equals 1, methane has a GWP of approximately 28-30, meaning it traps significantly more heat per unit in the atmosphere than carbon dioxide.
Which sectors produce the most greenhouse gas emissions, and where does electricity generation fit in?
Transportation produces the most greenhouse gas emissions at about 28-29%, while electricity generation follows as the second largest source at about 25%. Industry contributes approximately 23%, commercial and residential buildings account for 13%, and agriculture represents about 10% of total output.
How do greenhouse gas emissions raise global temperature, and why does it matter that methane and CO2 last different lengths of time?
Greenhouse gas emissions raise temperatures by trapping heat, with atmospheric CO2 having risen from about 280 ppm before industrialization to above 420 ppm. Because gases have different global warming potential (GWP) and atmospheric lifespans, CO2e (carbon dioxide equivalent) allows you to compare their varied impacts on warming.
Do solar panels and home batteries create greenhouse gas emissions during manufacturing, and can the panels be recycled at end of life?
Yes, solar panels create embodied emissions during manufacturing, which account for lifecycle emissions of 20 to 50 g CO2e per kWh. However, with a carbon payback time of 1 to 3 years and a lifespan of 25 to 30 years or more, they significantly reduce net greenhouse gas emissions.
Does home solar reduce Scope 1, Scope 2, or Scope 3 greenhouse gas emissions?
Home solar primarily reduces Scope 2 emissions for a household by displacing electricity that would otherwise come from the grid. By generating your own power, you avoid the average grid emission factor of about 0.37 kg CO2 per kWh, which helps lower overall atmospheric greenhouse gas emissions.