
Peak Sun Hours: Sizing Formula, Typical Values, Definition, Production Estimate, Derate Factor, Seasonal Swing, Daylight Difference, Data Sources, Heat and Shade Effects, Tilt and Tracking
Peak sun hours are the number of hours per day when sunlight intensity averages 1,000 watts per square metre. Key aspects include typical values, sizing formula, production estimate, definition, seasonal swing, derate factor, data sources, daylight difference, tilt and tracking, and heat and shade effects. This value turns the changing strength of daylight into a single figure that represents the energy a panel surface receives over a full day. A location with five of these hours receives the same total energy as five hours of constant full-strength sunlight, even if the sun is actually up for much longer. Typical values range from about three in cloudy northern regions to over six in desert areas, and they shift noticeably between winter and summer. The article goes on to explain how these figures feed into a sizing formula and a daily production estimate for a system. Regional sun data is also the reason that results for solar options near me can differ widely from those in another state or country.
Key Takeaways
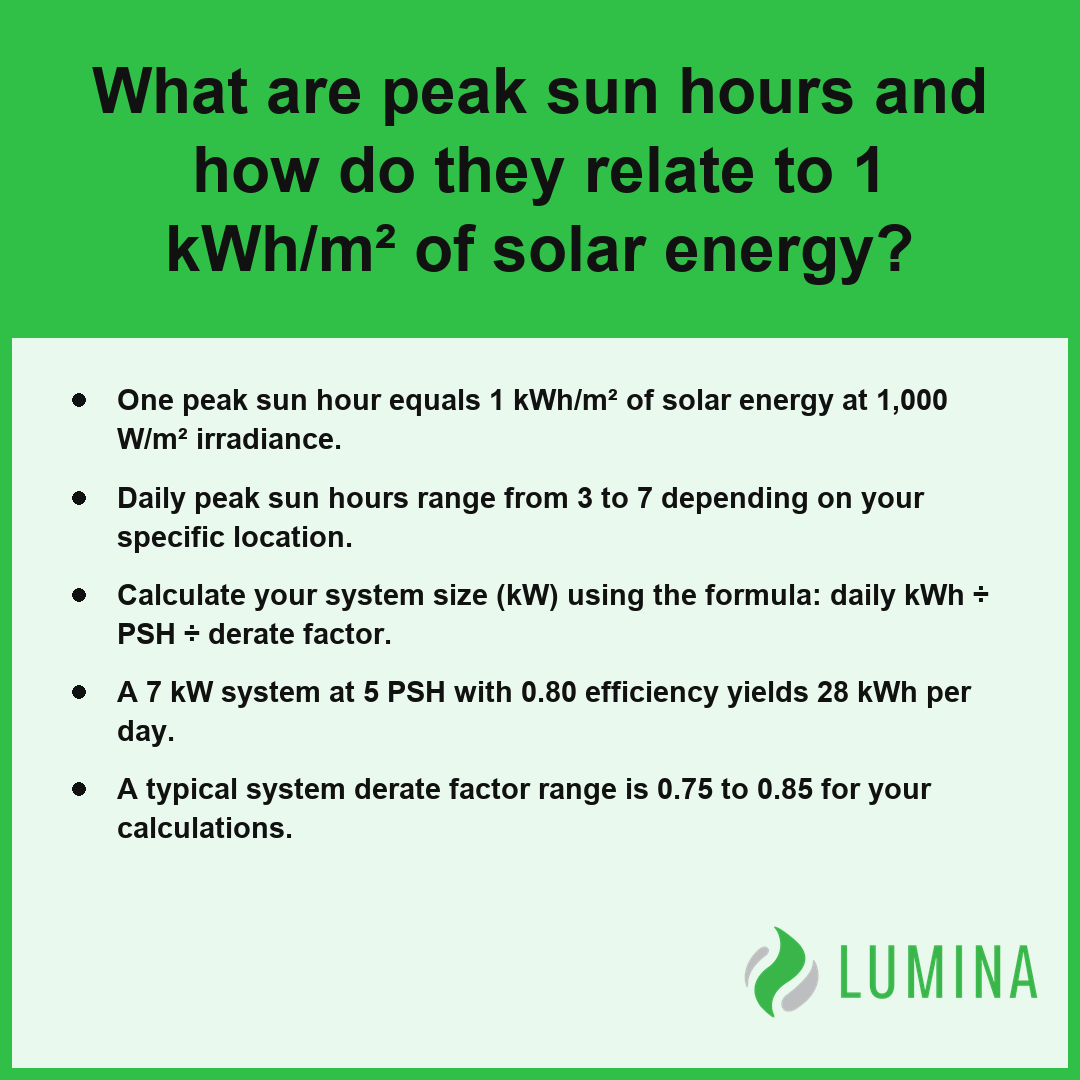
- One peak sun hour equals 1 kWh/m² of solar energy at 1,000 W/m² irradiance.
- Daily peak sun hours range from 3 to 7 depending on your specific location.
- Calculate your system size (kW) using the formula: daily kWh ÷ PSH ÷ derate factor.
- A 7 kW system at 5 PSH with 0.80 efficiency yields 28 kWh per day.
- A typical system derate factor range is 0.75 to 0.85 for your calculations.
What Are Peak Sun Hours and How Do They Relate to 1 kWh/m² of Solar Energy?
Peak sun hours are a measurement unit representing the total daily solar energy received by a surface, where one peak sun hour is equivalent to 1 kWh/m² of solar energy collected at an intensity of 1,000 W/m².
| Total Daily Solar Exposure (kWh/m²) | Equivalent Peak Sun Hours (PSH) | Energy Intensity Metric |
|---|---|---|
| 1 kWh/m² | 1 Hour | 1,000 W/m² (Standard) |
| 5 kWh/m² | 5 Hours | 1,000 W/m² (Standard) |
| 7 kWh/m² | 7 Hours | 1,000 W/m² (Standard) |
Daily Solar Energy to Peak Sun Hour Conversion
How Irradiance Turns Into a Peak Sun Hour Count
Irradiance measures the instantaneous power of sunlight, while peak sun hours aggregate that fluctuating intensity into a usable daily total. According to the National Renewable Energy Laboratory, a peak sun hour is approximately defined as the equivalent of one hour of solar irradiance at an intensity of 1,000 watts per square meter, which yields 1 kWh of solar energy per square meter. Since solar panels are rated under controlled, consistent intensity, this calculation bridges the gap between varying real-world irradiance and the laboratory expectations of your equipment.
Where Standard Test Conditions Fit In
Standard Test Conditions define the baseline for your equipment, specifying a 1,000 W/m² irradiance and a 25°C cell temperature. You can visualize the relationship between energy and these standards through the following conversion logic:
- Total Daily Irradiance of 1 kWh/m² = 1 peak sun hour
- Total Daily Irradiance of 5 kWh/m² = 5 peak sun hours
- Total Daily Irradiance of 7 kWh/m² = 7 peak sun hours
Why Peak Sun Hours Differ From Daylight Hours
Peak sun hours differ from daylight hours because they account for the varying angle and atmospheric density of sunlight throughout the day. While a location might experience 14 total daylight hours, much of that time involves low-angle light that does not reach the 1,000 W/m² intensity threshold required to generate full-rated output from your solar panels.
Review the specific irradiance data from the National Solar Radiation Database to see how your local morning and evening light contributions impact your daily total.
To calculate the expected energy output of a solar installation using these metrics, follow these steps:- Identify the average daily peak sun hours for your specific geographic location using local solar resource maps.
- Multiply your solar panel system’s DC power rating (in kilowatts) by the daily peak sun hour value.
- Apply a system derate factor (typically 0.75 to 0.85) to account for losses from wiring, inverters, and high ambient temperatures.
- Calculate the final result to estimate the approximate AC kilowatt-hours produced per day.
Typical Peak Sun Hours Per Day Across the US
Typical peak sun hours per day across the US range from 3 to 7, reflecting significant geographic variations in how much solar energy hits your panels. Per the National Oceanic and Atmospheric Administration, peak sun hour averages are geographically dependent, with higher latitude regions in the northern United States generally experiencing fewer daily peak sun hours compared to southern regions. These figures serve as a baseline for determining the potential productivity of your installation, as they consolidate varying daily irradiance into a consistent metric based on Standard Test Conditions. While northern regions often see lower daily averages due to latitude and weather patterns, the sun-drenched regions in the southwest receive considerably more intensity throughout the year.
| Geographic Region | Baseline Daily Peak Sun Hours | Seasonal Variation Extremes |
|---|---|---|
| Pacific Northwest and Northeast | 4.0 | 1.5 (Dec) to 7.0 (July) |
| Midwest and Southeast | 5.0 | Varies by local weather patterns |
| Desert Southwest | 6.5 | 5.0 (Winter) to 8.0 (Summer) |
Average Daily Peak Sun Hours by Region
- Pacific Northwest and Northeast: 3.5 to 4.5 average peak sun hours.
- Midwest and Southeast: 4.5 to 5.5 average peak sun hours.
- Desert Southwest: 6 to 7 average peak sun hours.
- Northern Seasonal Extremes: 1.5 to 2 in December compared to 6 to 7 in July.
- Southwest Seasonal Extremes: Roughly 5 to 8 peak sun hours depending on the season.
Use the National Solar Radiation Database or a PVWatts calculator to obtain a precise value for your specific coordinates, as local microclimates and nearby geographic features can cause your actual results to deviate from these regional averages.
How to Calculate Solar System Size From Peak Sun Hours
You calculate your solar system size from peak sun hours by determining how much energy your home requires and adjusting that figure for the specific irradiance and efficiency losses of your property. Because solar panels are rated at Standard Test Conditions, you must account for the reality that your panels will rarely experience perfect conditions throughout an entire day.
| System Efficiency Level | Derate Factor | Primary Loss Contributors |
|---|---|---|
| Lower Efficiency | 0.75 | High shading, significant wiring distance, high soiling, or older inverter tech |
| Average Efficiency | 0.80 | Standard residential installation with minimal shading and moderate system age |
| Higher Efficiency | 0.85 | Optimal orientation, clean panels, short wire runs, and high-performance inverters |
Estimated System Efficiency Loss (Derate Factor Impact)
- Determine your average daily electricity consumption in kWh by reviewing your utility bills over the past year.
- Identify your specific location’s PSH using the PVWatts calculator or data from the National Solar Radiation Database. Per the United States Department of Energy, peak sun hours are approximately defined as the number of hours per day during which the intensity of solar irradiance averages 1,000 watts per square meter.
- Select a derate factor between 0.75 and 0.85 to account for energy losses such as inverter inefficiency, wiring resistance, soiling, and shading.
- Divide your daily energy requirement by your PSH value, then divide that result by your chosen derate factor to determine the required system size (kW).
For example, if you consume 30 kWh/day and receive 5 PSH, dividing 30 kWh/day ÷ 5 PSH ÷ 0.80 derate factor gives 7.5 kW as your target system size (kW). Before finalizing your array capacity, verify your specific site’s shading patterns, as any obstructions will significantly lower your effective derate factor beyond standard estimates.
Follow these practical steps to refine your solar system capacity calculations:- Divide your daily energy requirement (kWh) by your local Peak Sun Hours (PSH) to establish the raw system size in kilowatts.
- Apply your chosen derate factor by dividing the raw system size by the factor (e.g., 0.80) to account for real-world energy losses.
- Consult your local municipality to verify maximum roof load requirements and specific fire setback regulations before finalizing the array footprint.
- Incorporate a 10-15% buffer into your final design to accommodate future increases in electricity demand or the addition of an electric vehicle.
How to Estimate Annual Solar Panel Production Using Peak Sun Hours
You estimate annual solar panel production using peak sun hours by multiplying your system size by the expected daily PSH and your system’s efficiency. Because your panels perform differently depending on environmental conditions and installation variables, you must account for these losses to reach a realistic annual total.
| Performance Scenario | Derate Factor | Accounting Scope |
|---|---|---|
| Conservative | 0.75 | Includes standard inverter losses, elevated wiring resistance, and higher-than-average soiling rates. |
| Optimistic | 0.85 | Assumes high-efficiency inverters, minimal wiring voltage drop, and pristine module surfaces. |
| Note: Temperature-based losses (0.3% to 0.5% per °C above 25°C) are additive and should be applied to these base factors for extreme climate modeling. | ||
Suggested Derate Factor Range
- Identify your system size (kW), which is the total capacity rating of your installed solar panels.
- Determine the average daily PSH for your specific location and array orientation using the PVWatts calculator or data from the National Solar Radiation Database.
- Select an appropriate derate factor between 0.75 and 0.85 to account for inverter losses, wiring resistance, soiling, and mismatch. Per the Office of Energy Efficiency and Renewable Energy, these derate factors are necessary to adjust for real-world variables like inverter efficiency, wiring losses, and module soiling.
- Calculate daily production by multiplying your system size (kW) by the daily PSH and your chosen derate factor.
- Multiply that daily production figure by 365 to determine your estimated annual solar panel production in kWh.
For example, a 7 kW system at 5 PSH with 0.80 efficiency yields about 28 kWh per day, resulting in an annual output of approximately 10,220 kWh.
Verify that your estimated annual total incorporates the 0.3% to 0.5% power loss per °C above 25°C to avoid overestimating production during your region’s hottest months.
Follow these steps to refine your energy production projection:- Multiply your system size (kW) by the daily PSH and the chosen derate factor to calculate the estimated daily AC energy output in kWh.
- Multiply that daily result by 365 to determine your projected annual energy production.
- Adjust your final result by the applicable temperature coefficient if your installation site experiences consistent extreme heat during peak sunlight hours.
- Compare your calculated estimate against historical utility bill data to validate the accuracy of your chosen derate factor.
How Peak Sun Hours Change Between Winter and Summer
Peak sun hours change between winter and summer as the sun’s angle and the length of daylight hours shift significantly throughout the year. According to the United States Department of Energy, solar energy production across the country typically reaches its highest point during the summer months when longer days and increased solar zenith angles work to maximize the intensity of irradiance on photovoltaic surfaces. Because the irradiance level is lower when the sun is near the horizon, your solar panels receive fewer peak sun hours during the shorter, colder days of winter compared to the long, bright days of summer.
Power Loss Rate per °C above 25°C
| Season | Northern Latitude PSH Range | Desert Southwest PSH Range |
|---|---|---|
| Winter (December) | 1.5–2 | 5 |
| Summer (July) | 6–7 | 8 |
This seasonal variance means your energy production will fluctuate, even if your solar panels remain fixed in place. While you may expect high yields in summer, be aware that heat lowers output, as solar panels lose roughly 0.3% to 0.5% of power per °C above 25°C. Consequently, the high PSH values of summer are partially offset by the heat-related efficiency drop, while the lower PSH values of winter are hampered by the sun’s lower intensity and reduced daylight hours.
Review your electricity usage patterns for the winter months to determine if your planned system size provides enough generation during these low-irradiance periods.
To optimize your solar installation for seasonal performance, consider the following maintenance and design strategies:- Clean solar panels regularly to remove debris, as lower winter sun angles make arrays more susceptible to shadowing and dirt accumulation.
- Install a monitoring system to track real-time power degradation against ambient temperature fluctuations.
- Ensure proper ventilation behind the panels to mitigate efficiency loss caused by high surface temperatures during summer months.
- Adjust tilt angles twice annually if your mounting system allows, prioritizing a steeper angle in winter to capture low-horizon sunlight.
Frequently Asked Questions
Are peak sun hours the same as hours of daylight?
No, peak sun hours are not the same as hours of daylight. Daylight hours measure the time between sunrise and sunset, while peak sun hours represent the equivalent time sunlight intensity averages 1,000 W/m². A location with 14 hours of daylight may only provide 4 to 6 peak sun hours.
What derate factor should I use with peak sun hours, and what losses does it include?
You should use a derate factor between 0.75 and 0.85 to account for various system losses. This factor covers efficiency reductions from inverter losses of 2-4%, wiring losses of 1-3%, and soiling losses of 2-5%, alongside other impacts like temperature, shading, and equipment mismatch during your energy production.
How much do panel tilt, orientation, and solar trackers change effective peak sun hours?
Panel tilt and orientation affect yield, with non-ideal angles potentially losing 10-20% of output compared to south-facing mounts at latitude. Tracking systems actively raise effective peak sun hours, with single-axis trackers adding 15-25% and dual-axis trackers increasing output by 30-35% compared to fixed-mount solar panels.
Do heat, shade, and snow reduce the peak sun hours my panels actually receive?
Yes, heat, shade, and snow reduce the usable energy your solar panels receive. High heat is particularly detrimental, causing a power loss of 0.3% to 0.5% per °C above 25°C. Additionally, physical obstructions like shade, clouds, smoke, or snow cover limit the irradiance available to the system.
Where can I look up peak sun hours by ZIP code, and which value should I use for grid-tied versus off-grid systems?
You can look up location-specific data using the PVWatts calculator, which relies on the National Solar Radiation Database. Use conservative annual averages for grid-tied systems to ensure long-term performance, while off-grid designs require selecting the lowest seasonal values to ensure reliable energy availability during limited peak sun hours.