
Irradiance: Peak Sun Hours, Standard Test Value, Units, Output Effect, Angle and Orientation, Typical Values, Components, Measurement and Data, Temperature Effect, Plane-of-array
Irradiance is the power of sunlight reaching a surface, measured per unit of area, usually in watts per square metre. Key aspects include standard test value, peak sun hours, output effect, units, typical values, angle and orientation, measurement and data, components, plane-of-array, and temperature effect. Irradiance is expressed in watts per square metre, and a panel’s electrical output rises and falls in close step with it. Panels are rated under a standard test value of 1,000 watts per square metre, which gives every module a common reference point. Real conditions vary widely, with clear midday sun often reaching 800 to 1,000 watts per square metre and overcast skies delivering only a fraction of that. Across a year, irradiance is summed into peak sun hours, a figure that shows how much usable energy reaches a surface each day, and it shapes what you can expect from solar panels in Pennsylvania. This article explains the units, the standard test value, typical readings, peak sun hours and the way irradiance affects panel output.
Key Takeaways
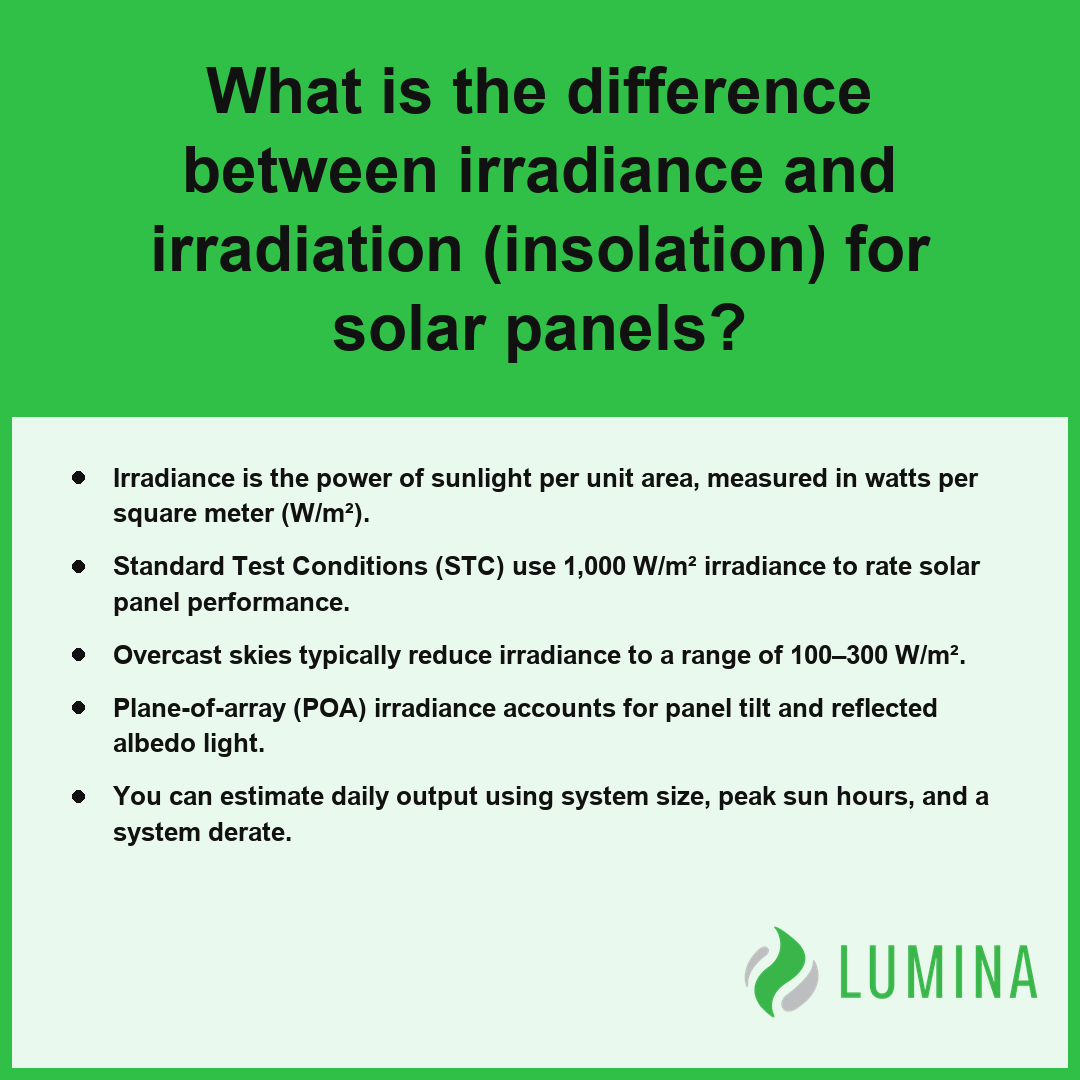
- Irradiance is the power of sunlight per unit area, measured in watts per square meter (W/m²).
- Standard Test Conditions (STC) use 1,000 W/m² irradiance to rate solar panel performance.
- Overcast skies typically reduce irradiance to a range of 100–300 W/m².
- Plane-of-array (POA) irradiance accounts for panel tilt and reflected albedo light.
- You can estimate daily output using system size, peak sun hours, and a system derate.
What Is the Difference Between Irradiance and Irradiation for Solar Panels?
The difference between irradiance and irradiation for solar panels is that irradiance measures the instantaneous power of solar radiation per unit area, while irradiation measures the total accumulated energy received over a specific time period.
You can think of irradiance as the speed of a car and irradiation as the distance traveled. Irradiance is expressed in watts per square meter (W/m²) and tells you exactly how much power is hitting your solar panel at any given moment. Conversely, irradiation is the cumulative result of that irradiance over time, typically measured in kWh/m² per hour, day, or year. According to the American Meteorological Society, irradiance functions as the intensity of the light resource at a specific moment, while irradiation provides the integrated total energy used to estimate the potential power output of a system over hours, days, or years. Distinguishing between these two terms is vital because while your solar panel’s current output fluctuates instantly with changes in irradiance, your total daily energy harvest depends on the cumulative irradiation.
| Metric | Unit of Measure | What It Represents |
|---|---|---|
| Irradiance | Watts per square meter (W/m²) | Instantaneous power density |
| Irradiation | kWh/m² | Total energy over time |
Monitor your monitoring system’s data log to distinguish between real-time power fluctuations caused by changing irradiance and total daily yield metrics derived from cumulative irradiation.
Understanding the practical application of these metrics helps in managing your solar system’s performance:- Use real-time irradiance data to troubleshoot localized issues like partial shading or intermittent cloud cover affecting immediate power output.
- Use cumulative irradiation data to forecast long-term system health, compare monthly performance against historical climate averages, and calculate return on investment.
- Configure monitoring alerts based on irradiation thresholds to identify potential equipment degradation or persistent soiling that reduces overall energy yield.
Why a 400 W Solar Panel Is Rated at 1,000 W/m² Irradiance Under Standard Test Conditions (STC)
A solar panel is rated at 400 W because Standard Test Conditions (STC) define a controlled benchmark where the module must produce that specific power output when exposed to a controlled irradiance of 1,000 W/m² at a cell temperature of 25°C.
Typical Power Temperature Coefficients (%/°C)
Why 1,000 W/m² Became the Rating Benchmark
A 400 W solar panel is rated at 1,000 W/m² irradiance under Standard Test Conditions (STC) because this value represents the consistent, measurable baseline of solar power available at sea level on a clear day with the sun at a high angle. Per the International Electrotechnical Commission, this 1,000 W/m² reference irradiance serves as a uniform baseline for comparing performance metrics across different manufacturers. By anchoring performance to this specific figure, manufacturers provide a universal metric that allows you to compare the potential power output of different modules fairly, regardless of where they are eventually installed.
What Changes Between STC and Real Rooftops?
Standard Test Conditions (STC) rely on a fixed 1,000 W/m² irradiance, an air mass 1.5 spectrum, and a cell temperature of 25°C. In real-world installations, these variables fluctuate constantly, causing actual performance to deviate from the factory label.
How Cell Temperature Above 25°C Reduces Output
While irradiance dictates the potential current a panel can generate, thermal conditions influence the efficiency of that conversion. Because solar panels lose power as they heat up, environmental factors significantly impact daily yields:
- Power loss per degree Celsius above 25°C cell temperature: about 0.3–0.4%
- Typical peak irradiance on real-world panels: 800–1,100 W/m²
- High-end irradiance during cloud-edge enhancement: above 1,200 W/m²
How Plane-of-Array (POA) Irradiance Differs From STC
While STC assumes a static irradiance value, plane-of-array (POA) irradiance is the actual total light hitting your tilted panel surface. Unlike the idealized lab benchmark, POA irradiance incorporates variables such as the angle of incidence, direct sunlight, scattered light from the sky, and reflected light from the surroundings. A critical factor in this real-world total is albedo, which varies based on the surface beneath the panels:
| Surface Type | Albedo Value |
|---|---|
| Grass or concrete | about 0.2 |
| Fresh snow | 0.8 or more |
Monitor your local weather patterns to determine how often your specific site experiences irradiance levels that deviate from the STC benchmark.
Several environmental and installation factors influence how a solar panel deviates from its STC-rated performance:- Air mass interference, where sunlight traveling through more of the Earth’s atmosphere filters out specific wavelengths.
- Angle of incidence, which determines how much sunlight reflects off the glass surface rather than being absorbed.
- Soiling and debris accumulation that physically obstruct light from reaching the photovoltaic cells.
- Voltage drop caused by resistance in the electrical wiring between the panels and the inverter.
How Much Irradiance Do Solar Panels Get on a Cloudy or Overcast Day?
Solar panels receive significantly reduced irradiance on a cloudy or overcast day, though they remain active despite the lack of direct sunlight. While clear, sunny conditions often provide irradiance levels near 1,000 W/m², cloud cover acts as a filter that scatters and absorbs solar energy. Under overcast conditions, irradiance typically drops to roughly 100–300 W/m², and during heavy, dark cloud cover, it can fall below 100 W/m². Despite these lower values, your solar panels continue to function by capturing diffuse irradiance, which allows them to maintain approximately 10–25% of their rated output even when the sun is not visible. According to the National Renewable Energy Laboratory, solar photovoltaic panels can generate between 10 percent and 25 percent of their typical clear-sky power output under heavily overcast conditions.
| Sky Condition | Estimated Irradiance (W/m²) | Relative Power Output | Dominant Light Component |
|---|---|---|---|
| Cloud-edge Spike | 1,200 | >100% | Direct + Scattered |
| Clear / Sunny | 1,000 | 100% | Direct Normal |
| Overcast | 100 – 300 | 10% – 25% | Diffuse Horizontal |
| Heavy Cloud Cover | < 100 | < 10% | Diffuse Horizontal |
Solar Irradiance Levels (W/m²)
The performance of your array during these periods is dictated by the composition of the light reaching the cells:
- Direct normal irradiance (DNI): This component vanishes almost entirely when clouds block the sun’s disk.
- Diffuse horizontal irradiance (DHI): This becomes the primary source of power, as light is scattered by water droplets and aerosols in the clouds.
- Global horizontal irradiance (GHI): The total irradiance reaching a flat surface is dominated by the diffuse component rather than direct beams during these weather events.
- Cloud-edge enhancement: You may occasionally experience a brief spike in irradiance above 1,200 W/m² if the sun emerges from behind a cloud edge, as reflections off the clouds intensify the light.
Observe the percentage of your system’s rated capacity during a heavy overcast afternoon to understand the baseline productivity of your specific panel technology in diffuse light conditions.
Several environmental and technical variables further influence how your solar array converts available light into electricity:- Spectral Response: Solar cells are optimized for specific light wavelengths; diffuse light under cloud cover shifts the spectrum, which may slightly alter conversion efficiency.
- Panel Temperature: Lower irradiance levels often coincide with cooler ambient temperatures, which can improve the voltage efficiency of photovoltaic cells.
- Angle of Incidence: Diffuse light arrives from all angles of the sky, potentially improving performance on modules oriented away from the sun’s direct path compared to clear-sky conditions.
- Inverter Clipping Thresholds: During “cloud-edge” events, rapid spikes in intensity may temporarily trigger inverter safety limits if the surge exceeds the system’s rated capacity.
How Many Peak Sun Hours Your Location Gets and How They Relate to Irradiance
Peak sun hours represent the number of hours your location receives an average irradiance of 1,000 W/m², allowing you to convert complex daily irradiance fluctuations into a simplified figure for energy production planning. While your actual irradiance levels change constantly throughout the day—starting low at sunrise, peaking near solar noon, and tapering off in the evening—the peak sun hour metric aggregates this total daily energy into a standardized timeframe. If your area records 5 kWh/m² of daily irradiation, your system effectively receives the equivalent of 5 peak sun hours at the reference level used for Standard Test Conditions (STC).
| U.S. Geographic Region | Average Daily Irradiation (kWh/m²) | Equivalent Peak Sun Hours | Solar Resource Classification |
|---|---|---|---|
| Cloudy Northern Regions (e.g., Pacific Northwest, Northeast) | 3.0 – 4.0 | 3.5 | Low to Moderate |
| Central and Southeastern Plains | 4.5 – 5.5 | 5.0 | High |
| Desert Southwest | 6.0 – 7.0 | 7.0 | Exceptional |
Annual Peak Sun Hours by U.S. Region
- Geographic Variance: Annual peak sun hours across the contiguous U.S. typically range from about 3–4 hours in cloudy northern regions to 6–7 hours in the desert Southwest. According to the United States Department of Energy, irradiance levels vary significantly across the country due to latitude and climate, with regions in the Southwest typically receiving higher annual solar resource values compared to the Northeast or Pacific Northwest.
- Energy Equivalence: Every 1 kWh/m² of daily irradiation received by your array is equal to 1 peak sun hour.
- Normalization: This metric allows you to compare the solar potential of different sites by normalizing the varying irradiance profiles into a singular, comparable value.
- Operational Baseline: Because a solar panel is rated at 1,000 W/m², multiplying your system size by your local peak sun hours provides a primary estimate of daily production before accounting for system derate.
Review the historical irradiance data for your specific site to determine whether seasonal shifts or local weather patterns significantly lower your available peak sun hours compared to regional averages.
Several environmental and systemic factors beyond geographical location influence the actual peak sun hours your solar array experiences:- Panel Tilt and Orientation: Aligning panels toward the equator at an angle equal to your latitude optimizes direct exposure, potentially increasing your effective peak sun hours compared to a flat installation.
- Soiling and Debris: Dust, pollen, snow, and bird droppings create physical barriers that reduce light absorption and lower the effective irradiance reaching the photovoltaic cells.
- Temperature Coefficients: High ambient temperatures reduce solar panel efficiency; even in high-irradiation zones, excessive heat can cause a measurable decline in total energy output.
- Shading Obstructions: Nearby trees, chimneys, or neighboring structures create micro-climates of shade that interrupt solar generation even when regional irradiance levels remain high.
How to Calculate Daily Solar Panel Output From Irradiance and System Size
Calculating daily solar panel output from irradiance and system size involves determining the total energy generated by applying system efficiency factors to the received sunlight over a specific period. Because a solar panel’s current is nearly proportional to irradiance, you can reliably estimate your system’s performance by utilizing your location’s peak sun hours—a metric that consolidates daily irradiation into an equivalent number of hours at the 1,000 W/m² benchmark.
| Calculation Variable | Value | Unit | Function in Estimate |
|---|---|---|---|
| System Capacity | 7 | kW | Defines nameplate generation potential |
| Peak Sun Hours | 5 | hours/day | Normalizes GHI to 1,000 W/m² benchmark |
| System Derate Factor | 0.80 | Coefficient | Adjusts for inverter, wiring, and heat losses |
| Estimated Daily Output | 28 | kWh/day | Final net energy production |
Components of Solar Daily Output Calculation
- Identify your solar array’s nameplate capacity in kilowatts (kW).
- Determine the average daily peak sun hours for your specific location.
- Apply a system derate factor (typically 0.80) to account for losses in wiring, inverters, and environmental conditions like high heat. Per the United States Department of Energy, these calculations must incorporate a derate factor to approximate energy losses resulting from wiring, temperature fluctuations, and inverter inefficiency.
- Multiply these three values together: Capacity (kW) × Peak Sun Hours × System Derate = Estimated Daily Output (kWh).
For example, a 7 kW system operating at 5 peak sun hours with a 0.80 derate will produce about 28 kWh per day. When performing these calculations, verify your local peak sun hours against a reliable solar resource map to ensure your estimate reflects the specific global horizontal irradiance (GHI) and plane-of-array (POA) irradiance characteristics of your site.
Adjust your performance expectations during summer months by accounting for the 0.3–0.4% power loss per degree Celsius that occurs when cell temperatures exceed 25°C.
To maximize the accuracy of your solar energy estimate, consider these additional site-specific factors:- Verify your roof orientation and tilt angle to determine the specific solar incidence angle compared to optimal regional benchmarks.
- Account for local seasonal variations by calculating expected performance during both winter and summer solstices.
- Audit the site for potential shading obstructions, such as nearby trees, chimneys, or neighboring structures that may reduce effective irradiance.
- Check the manufacturer’s datasheet for the specific temperature coefficient of your modules to refine the derate factor based on local climate data.
Frequently Asked Questions
What do DNI, DHI, and GHI mean in solar irradiance data?
DNI, DHI, and GHI represent the three components of irradiance: direct normal irradiance (DNI) is the power arriving straight from the sun, diffuse horizontal irradiance (DHI) is light scattered by the sky, and global horizontal irradiance (GHI) is the total irradiance measured on a flat horizontal surface.
What is plane-of-array irradiance and how does ground albedo or snow reflection affect it?
Plane-of-array (POA) irradiance is the total power received on the tilted surface of a solar panel, which includes ground albedo that reflects light onto the array. Albedo adds significantly to this value, ranging from about 0.2 for grass or concrete to 0.8 or more for fresh snow.
Why do solar panels produce less power on hot days even when irradiance is high?
Solar panels produce less power on hot days because higher temperatures decrease electrical output, typically falling about 0.3–0.4% per °C above the 25°C benchmark. Even with high irradiance, the increased heat reduces the efficiency of the conversion process, preventing the system from achieving its maximum potential power output.
What tilt and direction give solar panels the most irradiance over a year?
The ideal tilt and direction for maximizing annual irradiance generally involve facing the solar panel toward the equator at a tilt angle matching your local latitude. This positioning ensures the surface receives the highest cumulative global horizontal irradiance, which varies from about 1,200 to over 2,400 kWh/m² across various regions.
How is solar irradiance measured, and where can I find irradiance data for my address?
Solar irradiance is measured as the power of electromagnetic radiation arriving on a surface in watts per square meter (W/m²). You can find local data by looking up the annual global horizontal irradiance (GHI) or peak sun hours for your region to estimate your potential system output and site-specific irradiance.