
Wm2: Power Density, Standard Test Rating, Real-world Range, Insolation Conversion, Temperature Effect, Output Scaling, Definition, Reducing Factors, Test Condition Ratings, Measurement Types
Wm2 is the unit of watts per square metre, measuring how much solar power strikes or leaves a surface. Key aspects include standard test rating, power density, insolation conversion, real-world range, output scaling, temperature effect, reducing factors, definition, measurement types, and test condition ratings. Standard test conditions rate panels at 1000 wm2 of irradiance, which gives you a fixed reference for comparing nameplate output. In real conditions, sunlight at ground level usually ranges from near zero at night to about 1000 on a clear midday, with cloud and haze pulling it far lower. Power density works the same way for the panel itself, since a module’s output per square metre depends on how efficiently it converts that incoming light. Output scales roughly in proportion to irradiance, so a panel receiving 500 on its surface produces about half of its rated power, before temperature effects. DC solar installers use these figures to estimate array yield, and this article goes on to explain test ratings, real-world ranges, output scaling and the conversion of insolation into daily energy values.
Key Takeaways
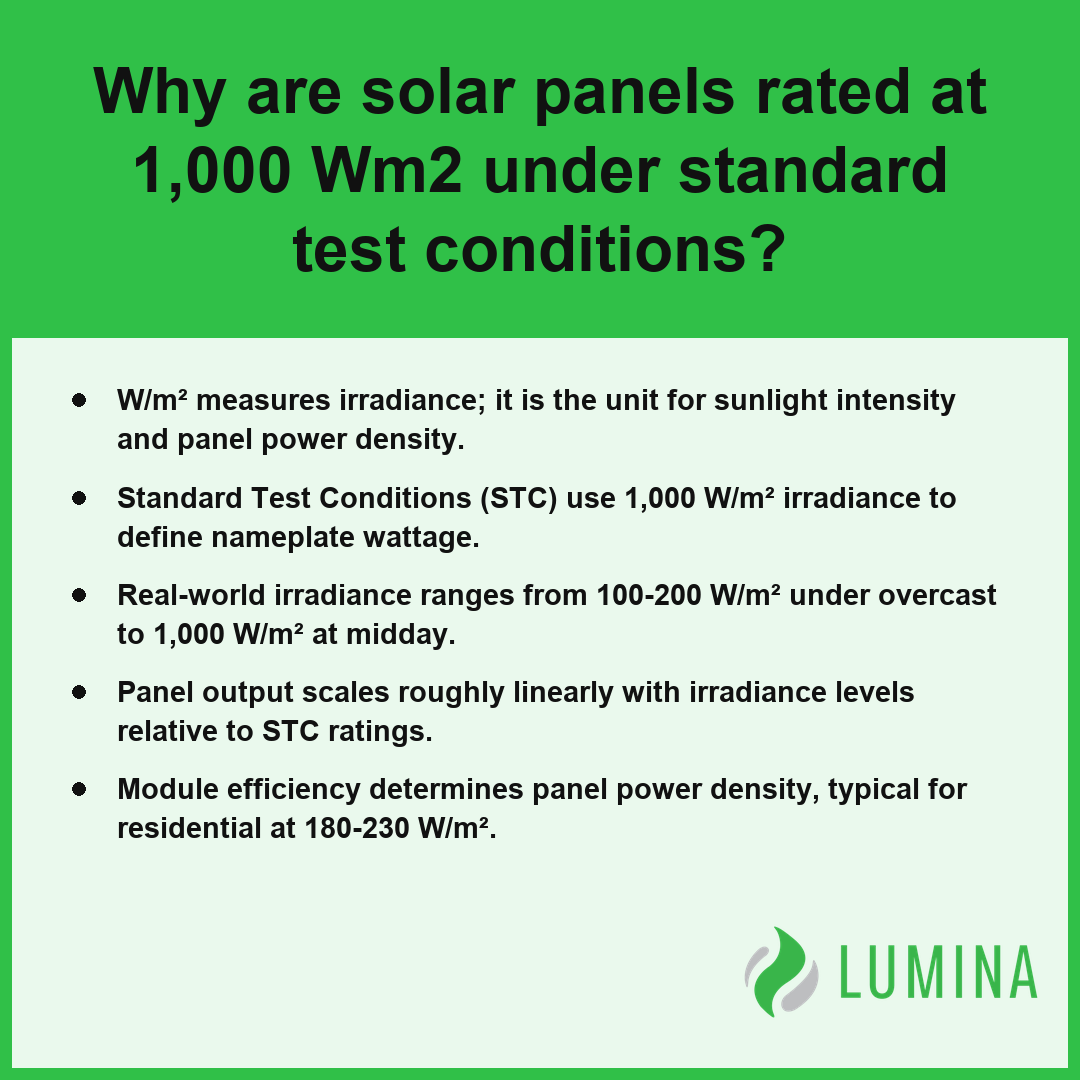
- W/m² measures irradiance; it is the unit for sunlight intensity and panel power density.
- Standard Test Conditions (STC) use 1,000 W/m² irradiance to define nameplate wattage.
- Real-world irradiance ranges from 100-200 W/m² under overcast to 1,000 W/m² at midday.
- Panel output scales roughly linearly with irradiance levels relative to STC ratings.
- Module efficiency determines panel power density, typical for residential at 180-230 W/m².
Why Are Solar Panels Rated at 1,000 W/m² Under Standard Test Conditions (STC)?
Solar panels are rated at 1,000 W/m² under Standard Test Conditions (STC) to provide a consistent, repeatable baseline that allows you to compare different products regardless of where or when they are tested. According to the American Society for Testing and Materials, this 1,000 W/m² irradiance standard is established to ensure all modules are evaluated against a uniform energy input that approximates the solar spectrum reaching the surface of the Earth. Because solar energy reaching the surface of the Earth is subject to constant fluctuations caused by atmospheric conditions, you need a stable reference point to determine nameplate wattage. While the solar constant above the atmosphere is about 1,361 W/m², the atmosphere absorbs and scatters this energy, typically reducing clear-sky irradiance to 1,000 W/m² when the sun is at its peak. By holding this irradiance constant alongside a fixed cell temperature of 25°C and a specific air mass 1.5 spectrum, manufacturers create a reliable metric for performance.
| Metric Category | Standard Value | Functional Significance |
|---|---|---|
| Solar Constant | 1,361 W/m² | Maximum potential energy flux located above the Earth’s atmosphere. |
| STC Irradiance | 1,000 W/m² | Uniform reference point for testing output potential at peak earth-surface conditions. |
| Standard Temperature | 25°C | Controlled thermal state to eliminate performance variance during benchmarking. |
| Spectral Filter | Air Mass 1.5 | Represents light attenuation through the atmosphere to simulate standard terrestrial spectrum. |
Solar Irradiance and Thermal Metrics
- 1,000 W/m²: The controlled irradiance used for STC.
- 1,361 W/m²: The solar constant measured above the atmosphere.
- 25°C: The cell temperature maintained during standard testing.
- Air mass 1.5: The standard spectrum representing the path length of sunlight through the atmosphere.
This standardized approach ensures that when you see a 400-watt rating on a specification sheet, you are viewing its output potential under that specific intensity of 1,000 W/m². Without this fixed unit, you would have no reliable way to verify the efficiency of a module or determine how it might perform relative to another unit under identical environmental inputs.
Check the data sheet for the temperature coefficient to understand how your expected yield will deviate from the 1,000 W/m² baseline once the panels heat up beyond 25°C in active service.
Key factors that influence how a solar panel performs outside of Standard Test Conditions include:- Angle of Incidence: Energy absorption decreases as the sun’s position moves away from a perpendicular angle relative to the panel surface.
- Temperature Coefficient: Actual power output typically drops as the panel’s operating temperature exceeds the 25°C baseline.
- Soiling Losses: The accumulation of dust, pollen, or debris on the glass surface reduces the amount of light reaching the photovoltaic cells.
- Spectral Response: Differences in the light spectrum throughout the day can slightly alter the conversion efficiency of the semiconductor material.
How Much W/m² Does a Solar Panel Actually Receive on Cloudy and Clear Days?
The W/m² that a solar panel actually receives on cloudy and clear days fluctuates significantly based on atmospheric conditions, transitioning from minimal levels during heavy storm cover to high intensity when the sky is unobstructed. While irradiance often hits the 1,000 W/m² mark during peak clear-sky conditions, the actual plane-of-array (POA) irradiance you experience fluctuates constantly due to the following variables:
| Sky Condition | Expected Irradiance (W/m²) | Atmospheric Behavior |
|---|---|---|
| Heavy Overcast | 100–200 | Significant reflection and scattering of energy by thick cloud cover |
| Partially Cloudy | Fluctuating (occasionally >1,000) | Variable light transmission combined with cloud-edge enhancement |
| Clear Midday | 800–1,000 | Optimal atmospheric penetration with minimal energy loss |
| Space Constant | 1,361 | Total solar energy available outside the Earth’s atmosphere |
Typical Irradiance Levels (W/m²)
- Heavy Overcast: Irradiance levels typically drop to between 100-200 W/m², as thick cloud cover reflects and scatters the majority of incoming energy.
- Partially Cloudy Days: Readings fluctuate wildly as clouds pass, occasionally experiencing cloud enhancement, where reflected light from cloud edges can briefly push irradiance levels above 1,000 W/m².
- Clear Midday: Per the National Renewable Energy Laboratory, peak sunlight conditions on a clear, sunny day typically provide an irradiance level of approximately 1,000 W/m² to a solar panel surface facing the sun. You generally observe irradiance between 800-1,000 W/m² on a clear day, assuming the panel is optimally oriented toward the sun.
- Atmospheric Scattering: Even on clear days, the sun does not deliver its full solar constant of about 1,361 W/m² to the ground because the atmosphere absorbs and scatters a portion of that energy before it reaches your array.
Monitor your system’s output during fluctuating cloud cover to identify how quickly your inverter responds to sudden drops and spikes in W/m² irradiance.
Several additional factors influence the final electrical output beyond raw solar irradiance:- Angle of Incidence: The efficiency of energy absorption decreases as the sun’s rays strike the panel surface at an oblique angle rather than perpendicular.
- Panel Temperature: High ambient temperatures increase the internal resistance of solar cells, leading to a measurable reduction in power conversion efficiency.
- Spectral Response: Photovoltaic materials are optimized for specific light wavelengths, meaning the changing spectral distribution caused by atmospheric filtering affects performance.
- Soiling Losses: The accumulation of dust, pollen, or debris on the panel surface physically obstructs photons, reducing the total irradiance reaching the cells.
How to Calculate Panel Power Density in W/m² From Wattage and Panel Size
Calculating panel power density in W/m² requires you to determine the ratio between a module’s nameplate power output and its total physical surface area. This calculation allows you to normalize performance comparisons between different hardware sizes, effectively showing how much power a specific unit generates per square meter under the 1,000 W/m² irradiance used in Standard Test Conditions (STC).
| Module Tier | Benchmark Efficiency | Power Density at STC | Typical Application Use Case |
|---|---|---|---|
| Standard Efficiency | 21% | 210 W/m² | Large-scale installations with ample roof space |
| High-Efficiency Premium | 23% | 230 W/m² | Space-constrained environments requiring maximum yield |
Solar Efficiency Comparisons
- Identify the maximum power rating (Pmax) of the solar panel in watts from the manufacturer’s datasheet.
- Measure or find the total surface area of the panel in square meters; this is typically calculated by multiplying the width by the length of the module frame.
- Divide the wattage by the area to find the power density expressed in W/m².
- Calculate the module efficiency by dividing your resulting W/m² value by 1,000 W/m² and multiplying by 100 to get a percentage.
Per the Department of Energy, solar panel efficiency ratings are generally determined by comparing the power output in watts per square meter against the standard solar irradiance of 1000 W/m² received at the Earth’s surface. For example, a 400 W panel covering approximately 1.9 m² provides a power density of roughly 210 W/m², indicating a module efficiency of 21%. When evaluating potential equipment, use these metrics to assess the following space-related considerations:
- Available mounting surface area relative to your total energy requirements.
- The influence of frame dimensions on installation constraints.
- Performance premiums offered by high-efficiency models that exceed 23% efficiency.
Compare the manufacturer’s stated module efficiency against the calculated W/m² to ensure the physical footprint of the array aligns with your available roof or ground space.
To optimize your panel assessment, follow these technical verification steps:- Verify the nameplate Pmax under Standard Test Conditions (STC) rather than Nominal Module Operating Temperature (NMOT) values to ensure consistency.
- Measure the exterior frame dimensions accurately, as total module footprint—not just the cell area—determines your site layout density.
- Cross-reference the calculated efficiency against the manufacturer’s provided temperature coefficient to estimate performance degradation in real-world hot climates.
- Account for the module’s frame-to-glass ratio, as larger frames can artificially lower density despite high-performance cell technology.
How Much Power Does a Solar Panel Produce at 500 W/m², and What Is the Minimum W/m² for It to Work?
At 500 W/m², a solar panel produces approximately half of its nameplate wattage, and the minimum W/m² required for a panel to begin producing measurable power is typically around 10 to 50 W/m². While electrical production scales predictably with available light, reaching the activation threshold depends on the specific inverter and internal circuitry rather than the solar cells alone.
Power Output at Varying Irradiance
How Output Scales With Irradiance
Because photovoltaic cells are linear devices, current output tracks closely with the amount of W/m² hitting the surface. Per the National Renewable Energy Laboratory, solar panels typically generate about half of their rated power output at an irradiance of 500 W/m² because production scales roughly linearly with sunlight intensity. If your panel receives 500 W/m², the current output drops proportionally, though voltage remains relatively stable. Minor efficiency losses occur at lower irradiance levels because the internal resistance of the cells becomes more dominant relative to the total power generated.
What Is the Lowest W/m² at Which a Panel Produces Power?
Energy production does not cease abruptly at a specific threshold, but it effectively hits zero once the voltage produced by the panel fails to meet the “start-up” voltage required by your grid-tied inverter. The following table summarizes how various irradiance levels impact operational status:
| Irradiance Level | Operational Impact |
|---|---|
| 1,000 W/m² | Maximum rated output (STC) |
| 500 W/m² | Approximately 50% power output |
| 200 W/m² | Low-light performance mode |
| <50 W/m² | Inverter shutdown or standby |
Why the Temperature Coefficient Shifts the Result
While irradiance determines the potential power, actual output is constrained by the temperature coefficient, which dictates that output falls about 0.3-0.4% per °C above 25°C cell temperature. Even at 500 W/m², a hot day can pull your total wattage lower than the linear scale would predict.
How NOCT Compares With STC Output
NOCT provides a more realistic performance expectation than STC because it assumes 800 W/m² irradiance paired with a 20°C ambient temperature and 1 m/s wind. This measurement acknowledges that panels rarely operate at the 25°C cell temperature required for their maximum nameplate rating.
Check your inverter specifications to confirm its minimum startup voltage threshold to understand when your system will stop generating power during the dawn and dusk hours.
Factors influencing the actual power generation of a solar array include:- Temperature Coefficient: As solar cells heat up beyond standard test conditions (25°C), their voltage output decreases, reducing total power even if irradiance remains constant.
- Spectral Response: Photovoltaic materials convert specific light wavelengths more efficiently, meaning the quality of sunlight—not just the intensity—affects output.
- Angle of Incidence: Power density is maximized when sunlight strikes the panel perpendicular to the surface; angled light increases reflection and decreases absorption.
- Soiling and Shading: Accumulations of dirt or localized shadows trigger bypass diodes, which can disproportionately reduce total power output compared to the reduction in light intensity.
How to Convert W/m² to kWh Per Day or Peak Sun Hours
Converting W/m² to kWh per day or peak sun hours is a mathematical process that shifts your focus from instantaneous irradiance to total daily insolation. Because 1 peak sun hour is defined as 1 kWh/m², you can determine the total energy available by integrating your irradiance data over the course of a single day. Per National Oceanic and Atmospheric Administration, converting W/m² to daily energy output involves multiplying the average irradiance by the number of hours of sunlight and dividing by 1,000 to reach a kilowatt-hour value that standardizes solar energy availability for system sizing.
| Regional Sunlight Classification | Peak Sun Hours (kWh/m²/day) | Irradiance Scaling Factor | System Sizing Impact |
|---|---|---|---|
| Low-End Estimate | 3.5 | 0.0035 kW/m² per hour average | Requires higher surface area or efficiency |
| High-End Estimate | 7.0 | 0.0070 kW/m² per hour average | Optimized for maximum output density |
Typical Peak Sun Hours by Region
- Collect the irradiance data for your specific plane-of-array (POA) irradiance throughout the day, measured in W/m² using a pyranometer.
- Calculate the average irradiance in W/m² for each hour of the daylight period.
- Divide each hourly value by 1,000 W/m² to convert the power density units into kilowatt-hours per square meter (kWh/m²).
- Sum these hourly values to arrive at the total daily insolation in kWh/m², which is equivalent to the total number of peak sun hours for that location.
While shorthand like wm2 is often used in casual notes, ensure your calculations remain consistent with the standard unit of W/m² to avoid errors when sizing your system for specific regional averages of 3.5-7 peak sun hours. Calculate your average daily yield by multiplying your total annual insolation by the specific module efficiency of your hardware.
Follow these additional steps to ensure accurate solar assessment and system sizing:- Account for the solar panel temperature coefficient, as high irradiance levels often lead to heat-induced voltage drops.
- Apply a derating factor to compensate for system losses, including wiring resistance, inverter efficiency, and dust accumulation.
- Adjust your calculated daily insolation values based on the specific tilt and azimuth of your installation compared to the horizontal plane.
- Verify that your local grid connection or battery storage capacity can accommodate the peak instantaneous power generated during the maximum sunlight hours.
Frequently Asked Questions
What does Wm2 mean in solar panels?
Wm2, or W/m², is a common shorthand for watts per square meter, the unit of power per unit area used for solar irradiance and panel power density. It measures the intensity of light landing on a surface or the power output capacity relative to a panel’s total surface area.
Why does my solar panel produce less power on a hot day even when W/m² is high?
Your solar panel produces less power on a hot day because its output falls about 0.3-0.4% per °C above 25°C cell temperature. Even when high irradiance provides significant energy, rising temperatures create a negative temperature coefficient that reduces overall electrical efficiency compared to Standard Test Conditions (STC) ratings.
What is the difference between GHI, DNI, DHI and plane-of-array W/m², and how is each measured?
These terms describe different types of irradiance: Direct Normal (DNI), Diffuse Horizontal (DHI), and Global Horizontal (GHI). Plane-of-array (POA) irradiance is the specific energy a tilted panel receives. Each is measured using a pyranometer, which precisely tracks the rate of solar energy reaching the designated surface area or orientation.
What reduces the W/m² reaching my solar panels, such as shade, tilt, and dust?
Shade, improper tilt, and dust reduce the W/m² reaching your panels by blocking or scattering sunlight before it hits the surface. These physical obstructions decrease the plane-of-array (POA) irradiance, preventing the panels from achieving their maximum potential output as defined during Standard Test Conditions (STC) at 1,000 W/m².
What is the difference between a panel’s NOCT rating at 800 W/m² and its low-light rating at 200 W/m²?
The NOCT rating uses 800 W/m² to provide a realistic estimate of performance under 20°C ambient temperatures and wind, whereas the low-light rating at 200 W/m² evaluates how panel efficiency drops when sunlight is sparse. Both metrics provide better context for expected energy yields than standard peak ratings in wm2.