
Power Rating: Real-world Output, Wattage Range, System Size, Energy Production, Efficiency, Test Conditions, Voltage and Current, Degradation, Temperature Coefficient, Tolerance
A solar panel’s power rating is the maximum electrical output, in watts, that it produces under standardized laboratory test conditions. Key aspects include wattage range, real-world output, energy production, system size, test conditions, efficiency, degradation, voltage and current, tolerance, and temperature coefficient. Panels are tested at 1000 watts per square metre of sunlight and a cell temperature of 25 degrees Celsius, which is why most modern residential models fall roughly between 350 and 450 watts. Real-world output usually sits below that figure because heat, shading, dust, roof angle and inverter losses all reduce what your panels deliver. Multiplying the rated wattage by the peak sun hours at your location gives an estimate of daily energy production in kilowatt-hours. Adding up the ratings of every panel determines your system size, which is the number that quotes from solar providers near me and elsewhere use to describe a complete installation. The sections below explain test conditions, wattage ranges, real-world output, energy production and system size in turn.
Key Takeaways
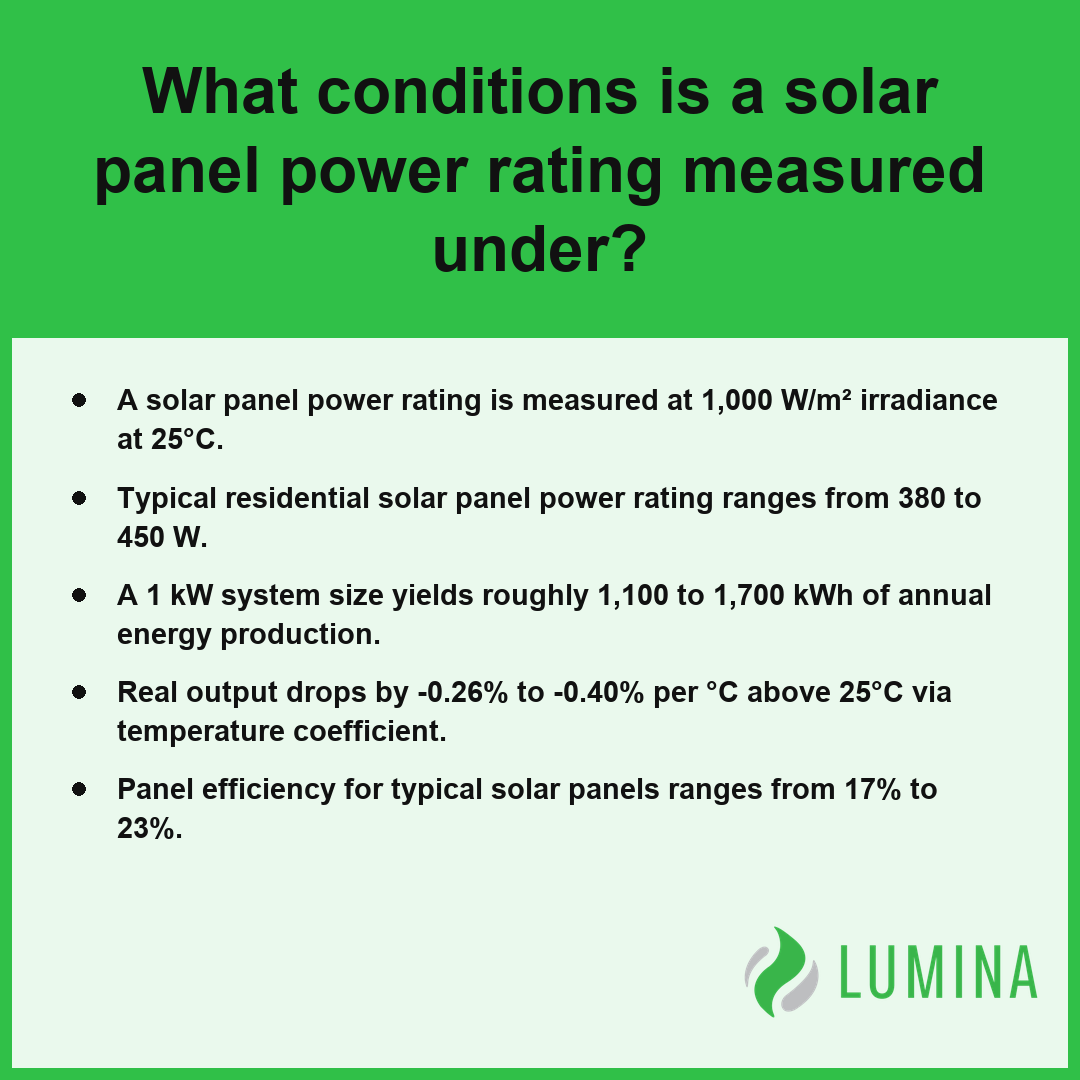
- A solar panel power rating is measured at 1,000 W/m² irradiance at 25°C.
- Typical residential solar panel power rating ranges from 380 to 450 W.
- A 1 kW system size yields roughly 1,100 to 1,700 kWh of annual energy production.
- Real output drops by -0.26% to -0.40% per °C above 25°C via temperature coefficient.
- Panel efficiency for typical solar panels ranges from 17% to 23%.
What Conditions Is a Solar Panel Power Rating Measured Under?
A solar panel power rating is measured under a controlled laboratory environment designed to provide a universal benchmark for comparing different modules. This specific testing environment is known as Standard Test Conditions (STC).
| Metric Category | Standard Test Condition (STC) Specification | Real-World Environmental Impact |
|---|---|---|
| Sunlight Intensity | 1,000 W/m² (Irradiance) | Fluctuates based on cloud cover, time of day, and season |
| Thermal State | 25°C (Cell Temperature) | Varies by ambient heat and roof ventilation efficiency |
| Atmospheric Filter | 1.5 (Air Mass Index) | Changes with sun angle and local latitude/altitude |
| Production Margin | 0 to +5 W (Power Tolerance) | Accounting for manufacturing variances in current and voltage |
Solar Panel Power Tolerance Ranges
What Standard Test Conditions (STC) Specify
To ensure consistency across the industry, manufacturers evaluate every solar panel using a set of rigorous baseline metrics. According to the International Electrotechnical Commission, these conditions are defined by an irradiance of 1,000 watts per square meter, a cell temperature of 25 degrees Celsius, and an air mass of 1.5. These factors create the foundation for the rated watts you see on a product datasheet.
- Irradiance level: 1,000 W/m² of sunlight intensity
- Cell temperature: 25°C
- Air mass: 1.5 spectrum
By keeping these variables static, manufacturers can calculate the power rating by multiplying the voltage at maximum power (Vmp) by the current at maximum power (Imp). Furthermore, panels typically feature a power tolerance of 0/+5 W or ±3% to account for minor variations during the manufacturing process.
Why Is Your Roof Different From Standard Test Conditions (STC)?
Your roof rarely replicates the laboratory environment because environmental variables constantly shift throughout the day. While STC provides a reliable baseline for comparison, your actual energy production fluctuates based on external stressors.
How Temperature Coefficient Changes Output
The most significant deviation occurs due to heat. Solar cells become less efficient as they warm up, a phenomenon defined by the temperature coefficient of power. This factor typically ranges from -0.26% to -0.40% per °C above 25°C. When your panels reach cell temperatures of 60°C to 65°C on a hot afternoon, you can expect an output reduction of approximately 10% to 14% compared to the power rating labeled on the back of the panel.
Review the temperature coefficient on your datasheet to estimate how much performance loss your system will face during the hottest months of the year.
Beyond the standardized testing metrics, several physical factors further influence how a solar module performs once it is installed on your roof:- Soiling and Debris: Accumulated dust, pollen, and bird droppings obstruct sunlight and can lead to localized hot spots on the panel surface.
- Wiring and Inverter Losses: Energy is inevitably lost as heat during the conversion process from direct current (DC) to alternating current (AC) and through electrical resistance in cabling.
- Angle of Incidence: The physical tilt and orientation of the mounting hardware determine how directly sunlight strikes the photovoltaic cells throughout the day.
- Degradation Rate: The chemical composition of the silicon cells naturally causes a slight reduction in output capacity for each year of operation.
How Many Watts Is a Good Solar Panel Power Rating for a Home?
A good solar panel power rating for your home typically falls within the range of 380 to 450 W, as this allows you to balance physical roof space with your total energy needs. Per the National Renewable Energy Laboratory, residential solar panels currently available for home installation typically range in power output from approximately 370 to 450 watts per module. Higher power rating models often reach 450 to 500 W or more, though the ideal choice depends on how much surface area is available and your specific household energy consumption patterns. Understanding the relationship between size and output ensures you do not pay for excess capacity or suffer from an underpowered system.
| Panel Category | Power Output Range | Best Application |
|---|---|---|
| Standard Modern | 380–450 W | Balanced cost and efficiency for average roof sizes |
| Premium High-Output | 450–500+ W | Limited roof footprints requiring maximum density |
| Efficiency Rating | 17%–23% | Determines physical space requirements |
| Power Tolerance | 0/+5 W or ±3% | Ensures delivery of rated performance specs |
Solar Panel Power Output (Watts)
- 380–450 W: Standard modern residential panels; these provide the most common balance of cost and efficiency.
- 450–500+ W: Premium modules suited for smaller roof footprints where maximizing output per square meter is essential.
- 17%–23%: The typical panel efficiency range that dictates how much space is required to achieve a specific power rating.
- 0/+5 W or ±3%: The common power tolerance you should verify to ensure the panels delivered to your home meet the expected performance specs.
Compare the power rating of different models against the total area of your roof to determine if you need high-efficiency panels or if a standard option will satisfy your needs.
Consider these additional factors when evaluating solar panel power specifications for your specific installation:- Check the temperature coefficient to understand how panel performance degrades in extreme heat.
- Verify the manufacturer’s degradation rate to estimate power output after 25 years of service.
- Confirm if the panel dimensions are compatible with your roof’s structural layout and mounting hardware.
- Review the product and performance warranty terms to ensure long-term output protection.
Why Your Solar System Never Reaches the Power Rating on the Panel Label
Your solar system never reaches the power rating on the panel label because the laboratory-based Standard Test Conditions (STC) are designed to provide a uniform baseline for comparison rather than a guarantee of performance in your specific environment. When you look at the power rating of your equipment, you are viewing the results of a flash test performed at 1,000 W/m² of irradiance and a controlled 25°C cell temperature. In practical use, your panels encounter fluctuating variables that immediately pull output below these ideal levels. For example, high ambient temperatures trigger the temperature coefficient of power, which typically ranges from -0.26% to -0.40% per °C above 25°C, effectively throttling your current production as the hardware heats up.
| Efficiency Drain Variable | Operational Impact | Technical Rationale |
|---|---|---|
| Thermal Degradation | -10% to -14% | Cell temperatures frequently exceed the 25°C STC baseline, triggering negative power coefficients. |
| Inverter Clipping | Variable | System design ratios of 1.1–1.3 AC:DC force a hard ceiling on midday energy harvest. |
| Manufacturing Spread | -3% to +5% | Factory-floor flash test variances prevent exact output matching across identical modules. |
| Annual Decay | -0.8% annually | Cumulative material fatigue and physical weathering over the system’s operational lifespan. |
Performance Loss Factors (Estimated Impact)
Several physical and environmental factors contribute to this discrepancy between the printed power rating and what your system reports on a daily basis:
- Temperature Sensitivity: Cell temperatures regularly climb to 60-65°C, causing a 10-14% reduction in peak performance.
- Manufacturing Variance: Even with a common power tolerance of 0/+5 W or ±3%, production output remains subject to factory-floor fluctuation.
- System Clipping: Your inverter’s AC power rating often results in a DC-to-AC ratio of 1.1 to 1.3, which causes the system to cap or “clip” peak energy during the brightest midday hours.
- Long-term Aging: Your hardware experiences an annual panel degradation rate of 0.4% to 0.8% per year, gradually lowering the maximum output potential over the life of the array.
- Environmental Obstructions: According to the United States Department of Energy, factors such as panel orientation, local shading, and the accumulation of dust or debris reduce the effective irradiance reaching the cells, which prevents systems from consistently producing their peak rated wattage.
Review the temperature coefficient specifications on your individual data sheets to estimate how much performance loss to anticipate during the hottest months of your local summer.
Beyond these primary variables, several site-specific conditions further influence the actual energy yield of your installation:- Soiling Losses: The accumulation of dust, pollen, bird droppings, and snow creates shading that physically obstructs light absorption.
- Wiring and Connection Resistance: Voltage drops occurring within DC and AC cabling cause minor, yet persistent, ohmic energy dissipation.
- Spectral Response Variance: Atmospheric conditions, such as humidity and haze, shift the sunlight spectrum, which can deviate from the fixed STC reference spectrum.
- Mismatched Module Orientation: Variations in tilt angle or azimuthal alignment across a single string lead to uneven current generation, limiting the total string output to the lowest performing panel.
Solar Panel Power Rating in Watts vs. Energy Production in Kilowatt-Hours (kWh)
Solar panel power rating in watts represents the instantaneous maximum electrical output under Standard Test Conditions (STC), whereas energy production in kilowatt-hours (kWh) measures the total electricity generated over a period of time. Per the U.S. Department of Energy, a panel’s power rating reflects peak output under standardized conditions, while kilowatt-hours serve as the measurement for total energy produced or consumed over a given duration. While the power rating indicates the potential peak performance of your hardware in a controlled environment, the actual energy production you receive depends on how long and how effectively your system captures sunlight throughout the day. Because the power rating is a measure of capacity rather than a guarantee of utility, two systems with the identical power rating may produce vastly different amounts of energy based on their local climate and installation details.
| Metric Category | Primary Determinants | Performance Variability Factor | Measurement Context |
|---|---|---|---|
| Power Rating (Watts) | Physical efficiency (17%–23%) & surface area | Controlled STC Irradiance (1,000 W/m² at 25°C) | Instantaneous peak capacity |
| Energy Production (kWh) | Local peak sun hours & temperature coefficient | Annual degradation (0.4%–0.8% loss) | Cumulative output over time |
Solar Efficiency and Degradation Metrics
You can distinguish between these two metrics by considering the factors that influence them:
- Power rating: Primarily determined by the physical efficiency of the solar panel (17% to 23%) and the surface area available to collect 1,000 W/m² of irradiance at 25°C.
- Energy production: Primarily determined by your local peak sun hours, the system’s temperature coefficient of power (-0.26% to -0.40% per °C), and the annual degradation rate (0.4% to 0.8% per year).
To estimate your actual yield, multiply your total system size by your region’s average peak sun hours and apply a derate factor, which typically accounts for losses like inverter inefficiency and wiring resistance. This calculation converts your static capacity into a realistic expected annual generation, usually falling between 1,100 to 1,700 kWh per installed kW. Compare your projected annual kWh against your historical utility bills to ensure your system size aligns with your actual consumption habits.
To accurately assess your solar system’s long-term output, consider these practical evaluation factors:- Orientation and tilt angle: Aligning panels toward the sun’s path maximizes daily irradiance capture.
- Environmental shading: Proximity to trees, chimneys, or neighboring structures significantly impacts cumulative kWh.
- Soiling losses: The accumulation of dust, pollen, or debris on the glass surface reduces light absorption.
- Inverter efficiency: Energy conversion from DC to AC electricity incurs small but measurable losses.
- Temperature coefficient impact: High ambient temperatures decrease panel voltage, effectively lowering real-world power output.
How to Add Up Solar Panel Power Ratings to Size a System and Match It to an Inverter
You determine the system size and inverter compatibility by calculating the sum of every individual solar panel power rating and applying an appropriate DC-to-AC ratio. The total DC capacity is calculated by multiplying the number of panels by their specific rated watts, ensuring the aggregate power rating aligns with your desired energy production goals while remaining within the technical parameters of your inverter.
| System Component | Calculation Metric | Design Objective |
|---|---|---|
| Solar Array Size | Panel Count × Rated Watts | Align with Energy Production Goals |
| Inverter Compatibility | Total DC Capacity ÷ AC Output | Maintain 1.1–1.3 DC-to-AC Ratio |
| Electrical String Specs | Vmp × Imp | Stay Within Inverter Operating Range |
| Voltage Safety Margin | Total DC Voltage Rating | Prevent Damage During Cold Spikes |
Typical DC-to-AC Ratios
- Count the total number of solar panels you intend to install.
- Multiply that total by the power rating of a single panel to establish your total system size in kilowatts (kW).
- Determine your inverter’s maximum input capacity. Per the Department of Energy, the DC-to-AC ratio serves as a standard design metric to balance array power against inverter capacity for optimized system performance, with a ratio of 1.1 to 1.3 being typical for balancing cost and efficiency.
- Ensure the combined power rating of your panels does not exceed the inverter’s maximum allowed DC input, accounting for the possibility of minor clipping during peak sun hours.
- Verify that the cumulative voltage and current of your panel strings—calculated by multiplying Vmp by Imp—remain within the operating range specified by your inverter manufacturer.
Compare your total DC array power rating against the inverter’s maximum input voltage to prevent hardware damage during cold-weather temperature spikes.
Follow these sequential steps to finalize your system configuration:- Verify that your mounting surface can structurally support the combined weight of the selected quantity of panels and racking hardware.
- Confirm that the total string voltage at minimum local ambient temperature does not exceed the inverter’s maximum input voltage (Voc) rating.
- Secure all electrical connections according to local building codes to minimize resistance and prevent thermal degradation over time.
- Perform a final commissioning test to ensure the inverter accurately tracks the Maximum Power Point (MPP) of the installed array.
Frequently Asked Questions
How do voltage and current determine a solar panel’s power rating?
A solar panel’s power rating is determined by multiplying the voltage at maximum power by the current at maximum power. For instance, a solar panel operating at 41 V and 10.5 A results in a power rating of approximately 430 W, calculated under Standard Test Conditions (STC).
How does a solar panel’s power rating relate to its efficiency?
A solar panel’s efficiency relates to its power rating by the formula of rated watts divided by the product of panel area in square meters and 1,000 W/m². This calculation typically results in a panel efficiency range of 17% to 23% for most modern equipment.
What does power tolerance mean on a solar panel power rating, such as 0/+5 W?
Power tolerance defines the variance between the factory flash test results and the labeled power rating, with a common power tolerance being 0/+5 W or ±3%. This ensures that a solar panel marked at a specific wattage will provide at least that amount of power according to the manufacturer’s quality standards.
Does a solar panel’s power rating drop in hot weather?
Yes, a solar panel’s power rating drops in hot weather because the temperature coefficient of power typically ranges from -0.26% to -0.40% per °C above 25°C. When cell temperatures climb to 60-65°C, you can expect a decrease in actual output of approximately 10-14% compared to Standard Test Conditions (STC).
How much does a solar panel’s power rating decline over 25 years?
A solar panel’s power rating declines by an annual degradation rate of 0.4% to 0.8% per year. Consequently, manufacturers frequently provide warranties guaranteeing that the solar panel will retain 80-92% of its original power rating after 25-30 years of operation.