
Gigawatt: Panel Count, Homes Powered, Unit Conversion, Annual Output, Capacity Factor, Land Area, Build Cost, DC vs AC Rating, Market Scale
A gigawatt is a unit of power equal to one billion watts, or one thousand megawatts. Key aspects include homes powered, panel count, annual output, unit conversion, land area, capacity factor, DC vs AC rating, build cost, and market scale. In solar power, a gigawatt describes the combined capacity of many panels, often spread across large arrays or entire regions. You can use it to estimate how many homes a solar fleet could supply, since one gigawatt of capacity typically serves several hundred thousand average households once real-world output is factored in. Reports from solar companies in DC and elsewhere often use this unit when summarizing installed capacity across a market. The article goes on to explain how a gigawatt converts to megawatts and kilowatts, how many panels it takes to reach that capacity, how much land those panels occupy, and how much electricity they produce over a year.
Key Takeaways
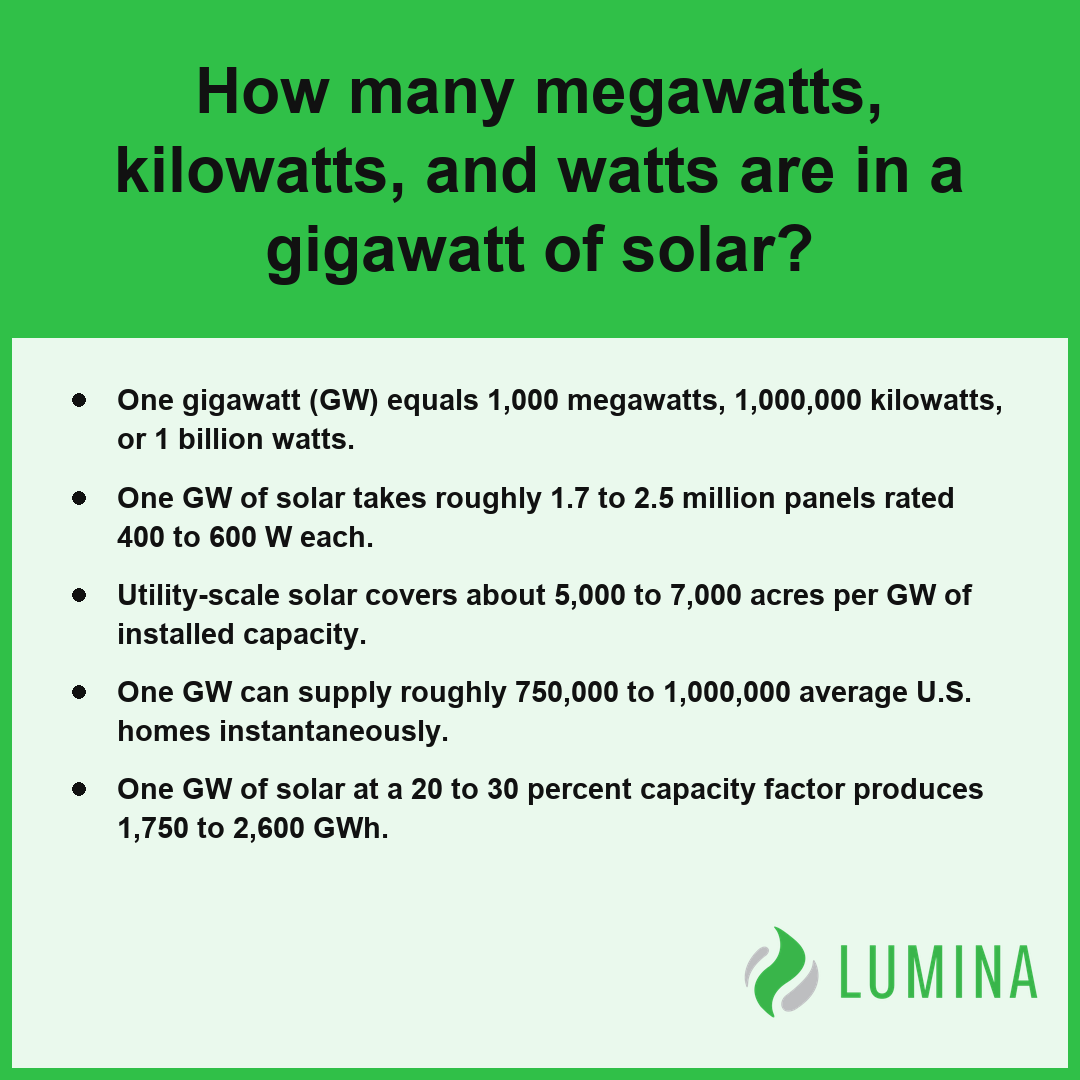
- One gigawatt (GW) equals 1,000 megawatts, 1,000,000 kilowatts, or 1 billion watts.
- One GW of solar takes roughly 1.7 to 2.5 million panels rated 400 to 600 W each.
- Utility-scale solar covers about 5,000 to 7,000 acres per GW of installed capacity.
- One GW can supply roughly 750,000 to 1,000,000 average U.S. homes instantaneously.
- One GW of solar at a 20 to 30 percent capacity factor produces 1,750 to 2,600 GWh.
How Many Megawatts, Kilowatts, and Watts Are in a Gigawatt of Solar?
A gigawatt (GW) contains a specific hierarchy of power units used to measure the capacity of solar energy installations. Understanding these subdivisions allows you to bridge the gap between small-scale residential systems and massive utility-scale solar projects. One gigawatt is a measure of power, which is the rate at which energy is being generated at a precise moment in time, rather than the total amount of energy produced over a duration. According to the National Institute of Standards and Technology, a gigawatt is approximately defined as one billion watts, which is equivalent to one thousand megawatts or one million kilowatts.
| Capacity Metric | Unit Value | Solar Application Scope |
|---|---|---|
| Terawatts (TW) | 0.001 TW | Global cumulative solar energy capacity |
| Gigawatts (GW) | 1 GW | Large-scale utility solar installations |
| Megawatts (MW) | 1,000 MW | Commercial facility and grid planning |
| Kilowatts (kW) | 1,000,000 kW | Residential rooftop system sizing |
| Watts (W) | 1,000,000,000 W | Base unit for nameplate capacity reference |
Hierarchy of a Gigawatt (1 GW)
- 1,000,000,000 watts (W): The base unit of power.
- 1,000,000 kilowatts (kW): The common unit for residential rooftop system sizing.
- 1,000 megawatts (MW): The standard increment for utility-scale solar facility planning.
- 0.001 terawatts (TW): The unit used to describe massive global cumulative solar capacity.
When you evaluate project scale, remember that these units describe the nameplate capacity of the solar panels under standard test conditions. To determine the actual performance, compare these values against the expected capacity factor for your region. Check the conversion ratio of the inverter systems you intend to use to ensure the DC-to-AC ratio aligns with your total planned output.
The following factors influence how these units are applied in practical solar engineering and project development:- Conversion Consistency: Maintaining a uniform unit format across project documentation is essential to prevent costly arithmetic errors during capacity planning.
- Grid Interconnection Limits: Power export limits established by utility companies are typically capped at specific megawatt levels, dictating the maximum allowable scale for commercial arrays.
- Performance Benchmarking: Solar output is normalized to kilowatts-peak (kWp) to compare the relative efficiency of different hardware manufacturers regardless of total system size.
- Load Balancing: Utility-scale project managers utilize gigawatt-level measurements to ensure that energy supply meets regional demand fluctuations during peak consumption hours.
How Many Homes Can a Gigawatt of Solar Power?
You can expect one gigawatt (GW) of utility-scale solar to supply roughly 750,000 to 1,000,000 average U.S. homes at the instantaneous level.
| Metric Category | Specification Type | Power Output Value | Impact on Home Supply |
|---|---|---|---|
| Theoretical Peak | Nameplate Capacity (DC) | 1,000 MW DC | 1,000,000 Homes (Instantaneous) |
| Grid Delivery | Typical AC Output | 900 MW AC | 900,000 Homes (Instantaneous) |
| Grid Delivery | Lower End AC Output | 750 MW AC | 750,000 Homes (Instantaneous) |
| Real-World Yield | Annual Capacity Factor (20-30%) | 150–300 MW Avg. | 150,000–300,000 Homes (Continuous) |
Solar Power Delivery (MW AC) vs Nameplate (MW DC)
Instantaneous Power Versus Annual Energy for an Average U.S. Home
A gigawatt (GW) of solar power can supply roughly 750,000 to 1,000,000 average U.S. homes at the instantaneous level. This figure represents the number of households you could power simultaneously if the solar arrays were producing at their peak nameplate capacity under perfect conditions.
DC-to-AC Ratio and the Real Power Delivered to the Grid
Because solar panels produce DC electricity that must be converted for the grid, the real power delivered is often lower than the nameplate rating. A 1 GW DC solar project typically delivers only about 750 to 900 MW AC due to the DC-to-AC ratio of 1.1 to 1.4. Factors affecting the number of homes supported include:
- Solar irradiance levels in your specific geographic region.
- The specific energy consumption patterns of local households.
- The operational DC-to-AC ratio of the power plant.
Why Nameplate Capacity and Capacity Factor Change the Home Count
Nameplate capacity represents the peak power of a system, while the capacity factor accounts for the reality that the sun does not shine at full strength 24 hours a day. With a typical solar capacity factor of 20 to 30 percent, the actual electrical output is significantly less than the theoretical maximum. Consequently, relying on nameplate figures alone often overestimates the number of homes you can support on a continuous, round-the-clock basis.
How Many Homes Does a Gigawatt-Hour (GWh) Cover Over a Year?
If you calculate coverage based on annual energy, 1 gigawatt-hour (GWh) serves a smaller, more consistent number of homes than the instantaneous peak rating. Because 1 GW of solar produces about 1,750 to 2,600 GWh per year, you must divide these totals by the average annual energy usage per home to determine total household coverage. Per the U.S. Department of Energy, one gigawatt of solar energy is generally sufficient to meet the annual electricity requirements of roughly 150,000 to 200,000 typical American homes.
Compare the anticipated annual capacity factor of your local utility-scale solar project against regional residential electricity demand to refine your baseline expectations.
Several external factors influence the total number of homes a solar project can effectively serve over its operational lifetime.- Insolation Variability: Geographic location and latitude dictate the solar irradiance received, directly impacting how many kilowatt-hours a system generates annually.
- Degradation Rates: Solar modules typically lose 0.5% to 0.8% of their efficiency each year, reducing the home-supply capacity over a 25-year project lifespan.
- Transmission Losses: Energy dissipated as heat during transportation from the utility-scale plant to the consumer further reduces the net electricity available for residential use.
- Consumption Patterns: Shifts in residential energy efficiency and the electrification of heating or transportation alter the “average” annual usage metric per household.
How Much Electricity a Gigawatt of Solar Produces in a Year
A gigawatt (GW) of solar produces approximately 1,750 to 2,600 GWh of electricity in a year, depending on the specific location and its corresponding capacity factor. Per the National Renewable Energy Laboratory, the actual annual electricity production of a one-gigawatt solar installation is determined by the capacity factor, which typically averages between 20 percent and 30 percent for utility-scale solar projects across various U.S. geographic locations. Because solar output fluctuates based on sun exposure and weather patterns, the grid relies on the capacity factor—the ratio of actual energy generated compared to the energy that would be produced if the system ran at its nameplate capacity for every hour of the year—to estimate annual production. While a natural-gas or nuclear plant with a 90 percent capacity factor generates about 7,900 GWh annually, solar requires 3 to 4 GW of capacity to match that total output, highlighting the variance in generation profiles between different energy sources.
| Capacity Factor | Estimated Annual Generation (per 1 GW) | Performance Implication |
|---|---|---|
| 20% | 1,750 GWh | Lower sun exposure or high cloud cover regions |
| 25% | 2,190 GWh | Average utility-scale performance baseline |
| 30% | 2,600 GWh | High irradiation zones (e.g., U.S. Southwest) |
Annual GWh Production per 1 GW of Solar Capacity
- 20 percent capacity factor: 1,750 GWh annual production
- 25 percent capacity factor: 2,190 GWh annual production
- 30 percent capacity factor: 2,600 GWh annual production
When planning for grid reliability, you must evaluate the local solar resource data and average sun hours to determine which end of this production range your specific gigawatt (GW) project will occupy.
Factors that influence the real-world operational capacity of a solar installation include:- Panel Tilt and Orientation: Aligning arrays toward the sun’s path throughout the day increases total energy capture.
- Soiling and Maintenance: Accumulation of dust, snow, or debris on panels reduces the effective light absorption surface.
- Inverter Efficiency: Conversion losses between DC electricity generated by panels and AC electricity delivered to the grid impact net output.
- Temperature Coefficients: Solar panels typically experience a decline in electrical efficiency as operating temperatures rise.
- Grid Curtailment: Local transmission constraints may lead grid operators to limit the amount of power a plant is allowed to export.
How Many Solar Panels It Takes to Make a Gigawatt
The number of solar panels it takes to make a gigawatt (GW) is roughly 1.7 to 2.5 million units, depending on the specific power rating of the hardware utilized. Per the Department of Energy, modern utility-scale solar photovoltaic modules commonly feature power ratings between 400 and 600 watts, which requires an approximation of 1.6 to 2.5 million individual panels to reach a one-gigawatt capacity. Because modern utility-scale solar installations rely on high-efficiency components, the total count fluctuates based on the wattage per individual solar panel, which typically ranges from 400 to 600 W per unit. This relationship highlights the density required to reach a gigawatt (GW) of nameplate capacity, which serves as the primary metric for project scale and manufacturing throughput.
| Module Efficiency Class | Required Units for 1 GW Capacity | Relative Installation Density |
|---|---|---|
| 400 W High-Output Module | 2,500,000 Panels | High Footprint Requirement |
| 500 W Standard Utility Module | 2,000,000 Panels | Moderate Footprint Requirement |
| 600 W Ultra-High Efficiency Module | 1,666,667 Panels | Optimized/Low Footprint Requirement |
Panels Required for 1 Gigawatt Capacity
- 400 W solar panel: Requires approximately 2,500,000 units to reach 1 gigawatt (GW).
- 500 W solar panel: Requires approximately 2,000,000 units to reach 1 gigawatt (GW).
- 600 W solar panel: Requires approximately 1,666,667 units to reach 1 gigawatt (GW).
- Manufacturing capacity: A factory designed to output 1 gigawatt (GW) annually typically produces roughly 2 million panels per year.
Compare the total panel count against the physical footprint of your site to determine if your land constraints favor higher-wattage modules that reduce the sheer volume of equipment needed for installation.
Factors influencing the real-world deployment of these modules include:- Land acquisition requirements, which scale based on the site’s ground coverage ratio (GCR).
- Interconnection infrastructure, such as substation capacity and step-up transformer specifications required to handle the 1 GW output.
- Environmental mitigation and permitting timelines necessary for large-scale solar arrays.
- Balance of System (BOS) costs, including racking, cabling, and inverter units proportional to the module count.
How Much Land a Gigawatt of Solar Needs
How much land a gigawatt (GW) of solar needs is determined primarily by the physical footprint of the array, which typically covers 5,000 to 7,000 acres, or roughly 8 to 11 square miles. This space must accommodate the layout of solar panels, access paths for maintenance vehicles, electrical equipment like inverters and transformers, and required setbacks from property boundaries. The actual land usage density depends on the mounting technology—such as fixed-tilt racks versus single-axis trackers—and the specific geographic features of the site, as developers often leave buffer zones for environmental or aesthetic considerations. Per the Environmental Protection Agency, utility-scale projects located on brownfields or formerly contaminated lands may experience varying acreage densities due to site-specific constraints, though these locations are increasingly prioritized to reduce the conversion of undeveloped greenfield land.
| Site Layout Component | Functional Requirement | Impact on Land Density |
|---|---|---|
| Mounting Technology | Fixed-tilt vs. Single-axis trackers | Trackers require wider row spacing to mitigate self-shading. |
| Infrastructure | Inverters, transformers, and substations | Consumes fixed area regardless of total solar capacity. |
| Operational Access | Maintenance paths and perimeter fencing | Increases footprint through non-generating service buffers. |
| Environmental Setbacks | Zoning and drainage buffers | Restricts usable acreage based on geographic topography. |
Acreage Required per GW of Solar Capacity
- Total Acreage: 5,000 to 7,000 acres per gigawatt (GW) of capacity.
- Total Square Mileage: Approximately 8 to 11 square miles.
- Variable Components: Space for inverter stations, access roads, perimeter fencing, and internal substations.
- Technology Impact: Single-axis tracking systems generally require more space to prevent self-shading during low sun angles compared to fixed-tilt installations.
- Optimization Constraints: Topography, drainage requirements, and local zoning ordinances frequently dictate how much of a purchased parcel can be utilized for active generation.
Review the topography and local zoning ordinances of your prospective project area to determine how much of your total acreage is truly developable for a gigawatt (GW) array.
Additional factors beyond site layout also influence the total land acquisition requirements for large-scale solar installations:- Topographic slope constraints often necessitate larger project areas to avoid steep terrain unsuitable for panel installation.
- Local solar irradiance levels influence the necessary capacity factor, which can lead to larger footprints in regions with lower sun exposure.
- Interconnection distance to the nearest electrical grid infrastructure may require additional acreage for transmission corridors and routing.
- Dual-use considerations, such as agrivoltaics or pollinator-friendly habitat requirements, may increase the total perimeter of the site.
Frequently Asked Questions
Why does solar need 3 to 4 gigawatts to match one gigawatt of gas or nuclear power?
Solar needs 3 to 4 gigawatts to match the annual output of gas or nuclear power because solar operates at a lower capacity factor. While a plant with a 90 percent capacity factor yields 7,900 GWh yearly, solar at a 20 to 30 percent capacity factor generates only 1,750 to 2,600 GWh.
What is the difference between a gigawatt DC and a gigawatt AC solar project?
A gigawatt DC refers to the nameplate capacity of panels, while a gigawatt AC represents the actual power output from inverters. Due to a typical DC-to-AC ratio of 1.1 to 1.4, a 1 GW DC solar project delivers only about 750 to 900 MW AC to the electrical grid.
How much does it cost to build a gigawatt of solar?
Building one gigawatt of solar costs roughly $1 billion to $1.6 billion. This estimate is based on the utility-scale solar installed cost, which ranges from $1.00 to $1.60 per watt DC. Total costs vary depending on site conditions and equipment requirements for your specific installation size.
How big is a gigawatt of solar compared with total U.S. and global installed solar capacity?
Total installed solar capacity is over 200 GW in the U.S. and exceeds 2,000 GW globally. While the U.S. adds roughly 30 or more GW per year, global annual installations are now measured in the hundreds of gigawatt (GW) units, reflecting the rapid growth of renewable energy infrastructure worldwide.
What does a 1 gigawatt solar panel factory produce, and how many panels is that per year?
A 1 gigawatt solar panel factory produces panels totaling 1 GW of nameplate capacity per year. This output corresponds to approximately 2 million solar panel units, as a single modern utility-scale solar panel is rated at about 400 to 600 W per gigawatt (GW).