
List of Photovoltaic Power Stations: Annual Output, Capacity, Land Use, Location, Cost, Plant Type, Components, Homes Powered, Lifespan
A list of photovoltaic power stations is a catalogue of solar farms ranked by capacity, output, location and land area. Key aspects include capacity, annual output, location, land use, plant type, cost, homes powered, components, and lifespan. Each entry usually states the rated capacity in megawatts, the yearly electricity generated in gigawatt-hours, and the site where the panels operate. Capacity shows the maximum power a plant can deliver, while annual output reflects how much energy it actually produces after sunlight, temperature and equipment losses. Land use is often given in hectares, which allows you to understand how much space each megawatt requires. Smaller regional markets, such as solar companies in Delaware, tend to work on projects far below the scale of the largest desert installations. The article goes on to explain how these four measures are defined, how they relate to one another, and why they differ between plants.
Key Takeaways
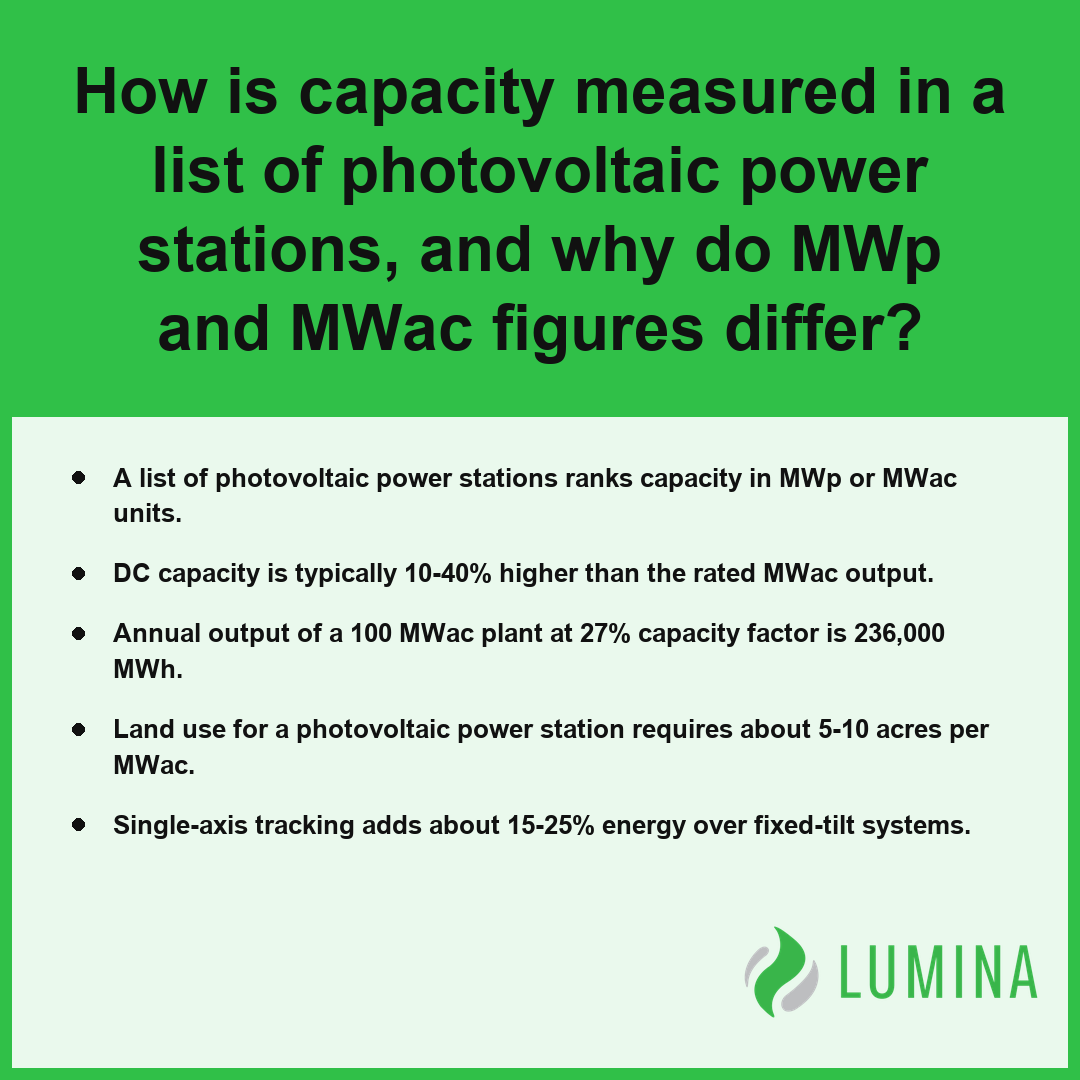
- A list of photovoltaic power stations ranks capacity in MWp or MWac units.
- DC capacity is typically 10-40% higher than the rated MWac output.
- Annual output of a 100 MWac plant at 27% capacity factor is 236,000 MWh.
- Land use for a photovoltaic power station requires about 5-10 acres per MWac.
- Single-axis tracking adds about 15-25% energy over fixed-tilt systems.
How Is Capacity Measured in a List of Photovoltaic Power Stations, and Why Do MWp and MWac Figures Differ?
Capacity in a list of photovoltaic power stations is measured using two distinct metrics, megawatts-peak (MWp) and MWac, because a photovoltaic power station converts raw solar energy into usable grid electricity through equipment that experiences inherent losses. You will find that these figures differ because the DC capacity rating is typically higher than the AC rating by 10-40% to account for inverter conversion efficiency, cable resistance, and temperature-induced power degradation. According to the Energy Information Administration, this discrepancy between MWp and MWac is an approximation of the efficiency of the power inverters and the site-specific design ratio, which accounts for factors like clipping losses when DC input exceeds the inverter’s maximum capacity.
| Loss Factor / Design Element | Impact on Capacity Variance (MWp vs. MWac) | Technical Consideration |
|---|---|---|
| Inverter Conversion Efficiency | Primary reduction mechanism | DC to AC power transition losses |
| Cable Resistance | Resistive energy dissipation | Ohmic losses within site cabling |
| Thermal Degradation | Efficiency drop | Reduced output due to high operating temperatures |
| DC-to-AC Clipping | Strategic optimization | Inverter capacity limitations during peak irradiance |
Typical Power Capacity Variance (DC vs AC)
When you review a list of photovoltaic power stations, understanding these underlying units ensures you are comparing technical specifications accurately:
- MWp (megawatts-peak): Represents the total power the solar modules can generate under standard test conditions before any electrical conversion occurs.
- MWac (megawatts-AC): Indicates the actual power delivered to the electrical grid after direct current from the modules is processed through inverters.
- Conversion Ratio: The variance between MWp and MWac accounts for the total system design, including the clipping of energy during peak sunlight hours to optimize inverter usage.
Designers adjust this ratio based on the specific local solar irradiance profile to maximize the cost-effectiveness of the power electronics. Always confirm whether the capacity listed refers to the total module rating or the functional output at the interconnection point before evaluating the scale of the site.
To better interpret these capacity metrics in project documentation, consider the following contextual indicators:- Inverter Loading Ratio (ILR): Check the DC/AC ratio, as ratios significantly exceeding 1.2 often indicate a project prioritized for energy yield over peak power capacity.
- Reporting Standards: Confirm whether the capacity listed refers to the nameplate capacity of the modules or the grid-interconnection limit defined by the utility agreement.
- Site Ambient Conditions: Adjust expected performance expectations based on the site’s average annual temperature, which influences the magnitude of thermal degradation beyond standard test conditions.
- Energy Curtailment Policies: Differentiate between technical clipping losses and grid-mandated curtailment, as the latter affects economic viability regardless of the inverter’s physical capacity.
How to Calculate the Annual Output of a Photovoltaic Power Station
Calculating the annual output of a photovoltaic power station involves multiplying the installed capacity in MWac by the total hours in a year and the specific capacity factor of the site. When you review any list of photovoltaic power stations, you will notice that total energy production is the primary metric for efficiency, rather than nameplate capacity alone. Because external conditions like irradiance and temperature vary significantly by location, you must account for these environmental inputs to arrive at an accurate projection. According to the National Renewable Energy Laboratory, the annual energy output of a photovoltaic system is approximately calculated by multiplying the system’s rated direct current capacity by the local peak sun hours and a performance derating factor that accounts for inverter efficiency, wiring losses, and temperature effects. For instance, a 100 MWac plant operating at a 27% capacity factor generates about 236,000 MWh per year, which is sufficient to power roughly 22,000 homes at 10,800 kWh each.
| Capacity Factor | Annual Generation (MWh) | Homes Powered Equivalent | Operational Efficiency Grade |
|---|---|---|---|
| 15% | 131,400 | ~12,166 | Low Yield |
| 20% | 175,200 | ~16,222 | Standard |
| 27% | 236,520 | ~21,900 | High Yield |
| 30% | 262,800 | ~24,333 | Peak Efficiency |
| Estimates based on a 100 MWac plant and an average household consumption of 10,800 kWh/year. | |||
Estimated Annual Generation by Capacity Factor (100 MWac Plant)
- Nameplate capacity (MWac): The peak power the station is rated to output under standard test conditions.
- Annual hours: The constant of 8,760 hours in a standard non-leap year.
- Capacity factor: The ratio of actual energy generated over a year to the potential energy if the plant operated at peak capacity 24/7.
- System losses: The inevitable reduction in energy due to wiring resistance, inverter inefficiency, and module degradation.
The calculation is essentially a measure of the site’s ability to convert raw sunlight into grid-ready power after accounting for these technical constraints. If you are comparing prospective sites, prioritize the expected capacity factor over the raw MWac nameplate, as the former dictates the actual revenue potential of the installation.
Factors that contribute to the variance in actual site performance include:- Soiling losses: Accumulation of dust, dirt, or snow on panel surfaces that reduces sunlight absorption.
- Grid curtailment: Intentional reduction in output dictated by grid operators to prevent thermal overload of transmission lines.
- Azimuth and tilt optimization: The physical orientation of the array relative to the sun’s path throughout the year.
- Component degradation: The natural, long-term decline in semiconductor performance of photovoltaic cells over their multi-decade lifespan.
- System downtime: Scheduled maintenance periods or unexpected electrical faults requiring repair.
Why Does a Ranking by Capacity Not Match a Ranking by Energy Produced, and What Is Capacity Factor?
A ranking by capacity does not match a ranking by energy produced because capacity measures the theoretical maximum power of a photovoltaic power station, whereas the capacity factor accounts for actual performance influenced by environmental and technical variables.
| System Configuration | Operational Logic | Capacity Factor Range | Relative Energy Yield |
|---|---|---|---|
| Utility-Scale Fixed-Tilt | Stationary mounting at a fixed angle | 22% – 30% | Baseline Reference |
| Single-Axis Tracking | Dynamic movement following solar path | 30% – 35% | +15% to 25% vs Fixed |
Typical Solar Capacity Factor Ranges
What Drives Capacity Factor Differences Between Stations
According to the U.S. Energy Information Administration, the capacity factor represents an approximation of the ratio of the actual energy generated by a solar facility over a period to the total energy it would have produced if it operated at full nameplate capacity throughout that entire period. Factors include solar irradiance, panel temperature, and system design. For utility-scale sites, you can expect a range of about 22-30%.
How Single-Axis Tracking Changes the Result
- Fixed-tilt: Relies on a stationary angle; energy yield is baseline.
- Single-axis tracking: Follows the sun’s path to increase yield by about 15-25% over fixed-tilt.
- Efficiency: Higher irradiance areas naturally push these systems toward the upper limit of the 30-35% range.
Does a Larger Station Always Produce More Energy?
No, a larger station does not always produce more energy because a site with a higher nameplate capacity on a list of photovoltaic power stations might have a lower capacity factor due to poor irradiance or suboptimal equipment. For instance, a smaller, high-efficiency site utilizing tracking can outperform a larger, fixed-tilt site. A 100 MWac plant at a 27% capacity factor generates about 236,000 MWh per year, which is sufficient for roughly 22,000 homes.
Why Solar-Plus-Storage Hybrid Sites Can Rank Differently
A solar-plus-storage hybrid site manages energy delivery timing rather than just raw volume. While the total energy produced might be lower due to round-trip losses in the battery, the station ranks differently in value by shifting generation to periods of peak grid demand. Always examine the capacity factor alongside the nameplate rating when assessing the true productivity of any entry on a list of photovoltaic power stations.
Several external variables influence the real-world operational efficiency of a photovoltaic installation beyond its tracking capabilities:- Soiling loss: The accumulation of dust, pollen, or snow on panel surfaces reduces light absorption and overall yield.
- Inverter conversion efficiency: DC-to-AC power conversion involves thermal losses that vary based on the inverter’s operating temperature and load.
- Grid curtailment: Utility operators may occasionally require stations to limit output to prevent grid congestion or maintain frequency stability.
- Wiring and interconnection losses: Resistive heating within the electrical collection system results in minor voltage drops between the panels and the point of interconnection.
Which Countries and Regions Host the Largest Photovoltaic Power Stations on World Lists
Countries and regions that host the largest photovoltaic power stations on any comprehensive list of photovoltaic power stations are predominantly those with vast, arid expanses and high levels of solar irradiance. You will find that these high-capacity sites are frequently situated in desert environments, where developers can aggregate millions of crystalline silicon modules across thousands of acres to capitalize on consistent sun exposure. Because these environments allow for massive scaling, governments and private developers in regions spanning Asia, the Middle East, and North America have prioritized large-scale land acquisition to develop multi-gigawatt installations.
| Global Region | Primary Geographic Driver | Development Strategy | Typical Site Scale |
|---|---|---|---|
| China | High-altitude arid terrain | Multi-gigawatt massive aggregation | Ultra-large scale |
| India | Western arid provinces | Extensive land-based site expansion | Large-scale utility |
| United Arab Emirates | Intense desert solar irradiance | High-efficiency desert installations | Multi-gigawatt |
| United States | Southwestern and southeastern deserts | Utility-scale land acquisition | 300 – 1,000 MWdc |
Typical Utility-Scale Solar Site Capacity (MWdc)
- China: Features massive desert-based developments, particularly in provinces known for expansive high-altitude terrain that supports multi-gigawatt projects.
- India: Utilizes large arid regions, such as those found in its western provinces, to host some of the most extensive individual sites globally.
- United Arab Emirates: Focuses on large-scale desert installations that reach multi-gigawatt capacity, benefiting from intense solar resources.
- United States: Concentrates utility-scale deployments in the southwestern and southeastern desert or arid regions, where individual sites frequently span ranges between 300 MWdc and 1,000 MWdc. Per the US Energy Information Administration, the United States hosts numerous utility-scale photovoltaic power stations primarily located in the desert Southwest, specifically in California, Nevada, and Arizona, due to high solar irradiance levels.
When you evaluate potential project locations, prioritize sites with high solar irradiance and minimal topographical obstructions to ensure the capacity factor supports the capital expenditure of such large arrays.
Key factors influencing the site selection and operational viability of these massive solar installations include:- Proximity to high-voltage transmission corridors to minimize energy loss during long-distance transport.
- Implementation of automated robotic cleaning systems to mitigate the impact of sand accumulation on panel efficiency.
- Geotechnical stability assessments to ensure foundations can withstand shifting desert sands and high wind loads.
- Integration of specialized cooling technologies or bifacial module configurations to maintain performance during peak thermal stress.
- Water accessibility for construction phases and maintenance, despite the arid climate.
How Much Land Does a Photovoltaic Power Station Need, and Can It Be Shared With Grazing or Crops?
A photovoltaic power station requires between 5 and 10 acres of land per MWac to accommodate the array spacing, maintenance access, and equipment footprint. When you consult a list of photovoltaic power stations, you will notice that land requirements vary based on the mounting technology employed, such as whether the panels utilize fixed-tilt systems or single-axis tracking. Beyond pure generation, these sites can indeed share space with other activities through dual-use strategies that maximize land efficiency.
| Co-location Strategy | Primary Agricultural/Environmental Benefit | Operational Role of Solar Array | Efficiency Goal |
|---|---|---|---|
| Agrivoltaics | Microclimate regulation for heat-sensitive crops | Provides partial shading to crops | Maximize dual-use land yield |
| Livestock Grazing | Natural vegetation management | Acts as shelter for small ruminants | Reduce mechanical/chemical maintenance |
| Floating PV | Water conservation and reservoir cooling | Covers surface to inhibit evaporation | Minimize terrestrial land footprint |
Land Requirement per MWac (Acres)
You can integrate these stations with secondary functions to improve overall project viability, provided that the design accounts for the physical needs of both the hardware and the biological or agricultural elements. The following land-use configurations represent common approaches to co-locating energy generation with other site activities:
- Agrivoltaics: Per the United States Department of Energy, this involves the practice of co-locating solar energy production alongside agricultural activities like crop cultivation or livestock grazing on the same land parcel, providing partial shade for heat-sensitive plants while reducing water evaporation.
- Livestock Grazing: Using sheep or other small ruminants to manage vegetation around panels, which reduces the need for mechanical mowing and chemical herbicides.
- Floating PV: Installing arrays on existing reservoirs or calm water bodies to minimize land displacement while simultaneously reducing evaporation from the water surface.
- Pollinator Habitats: Planting native wildflowers and grasses around the perimeter or between rows to support local biodiversity and soil health.
Evaluate your potential site for topography and soil compatibility before finalizing your layout to ensure that dual-use activities do not obstruct the long-term access required for cleaning and maintenance of the modules.
Key considerations for project developers when evaluating dual-use site viability include:- Assess soil health and local water table accessibility to support intended vegetation growth.
- Ensure racking heights and panel tilt angles are optimized to accommodate agricultural machinery or livestock clearance.
- Coordinate electrical infrastructure placement to minimize interference with irrigation systems or herd movement patterns.
- Conduct long-term studies on vegetation shade tolerance to ensure energy production does not conflict with crop yield objectives.
Frequently Asked Questions
What types of photovoltaic power stations appear on lists, such as fixed-tilt, tracking, floating, and solar-plus-storage?
Photovoltaic power station types commonly listed include fixed-tilt systems, single-axis tracking, floating PV, agrivoltaics, and solar-plus-storage hybrid configurations. Single-axis tracking is standard in new utility builds because it adds about 15-25% energy over fixed-tilt designs, while floating PV is utilized on reservoirs and solar-plus-storage hybrids are increasingly paired with battery systems.
What components and how many panels make up a large photovoltaic power station?
A large photovoltaic power station consists of thousands to millions of crystalline silicon modules, inverters, combiner boxes, transformers, and a substation for grid connection. A 500 MWdc site typically requires roughly 800,000 to 1,000,000 modules, each providing 400-700 W at 20-24% efficiency before connecting to the grid at 34.5 kV up to transmission voltage.
How much does it cost to build a utility-scale photovoltaic power station, and what do power purchase agreements pay per MWh?
Building a utility-scale photovoltaic power station costs roughly $1.00-1.60 per Wdc, while the levelized cost of energy is about $30-60 per MWh. Power purchase agreements determine the revenue for these projects, though actual costs for construction and operation are influenced by the specific site, equipment, and required energy transmission infrastructure.
How long do photovoltaic power stations last, and what happens to the panels at end of life?
The typical design life of a photovoltaic power station is 25-35 years, during which panel performance degrades by about 0.3-0.7% annually. Once these systems reach the end of their functional lifespan, the individual components are typically decommissioned, and the materials, such as glass, frames, and silicon cells, are often processed for material recovery.
How many homes can a photovoltaic power station on the list actually power?
A photovoltaic power station on the list of photovoltaic power stations can power roughly 22,000 homes using a 100 MWac plant at a 27% capacity factor, which provides about 236,000 MWh of annual output. This calculation assumes each residence consumes approximately 10,800 kWh annually, though individual station output varies by site sun resources.