
Solar Power Plant: Energy Output, Capacity, Land Use, Cost, Mounting Type, Components, Grid Connection, Lifespan, Storage and Variability, Maintenance
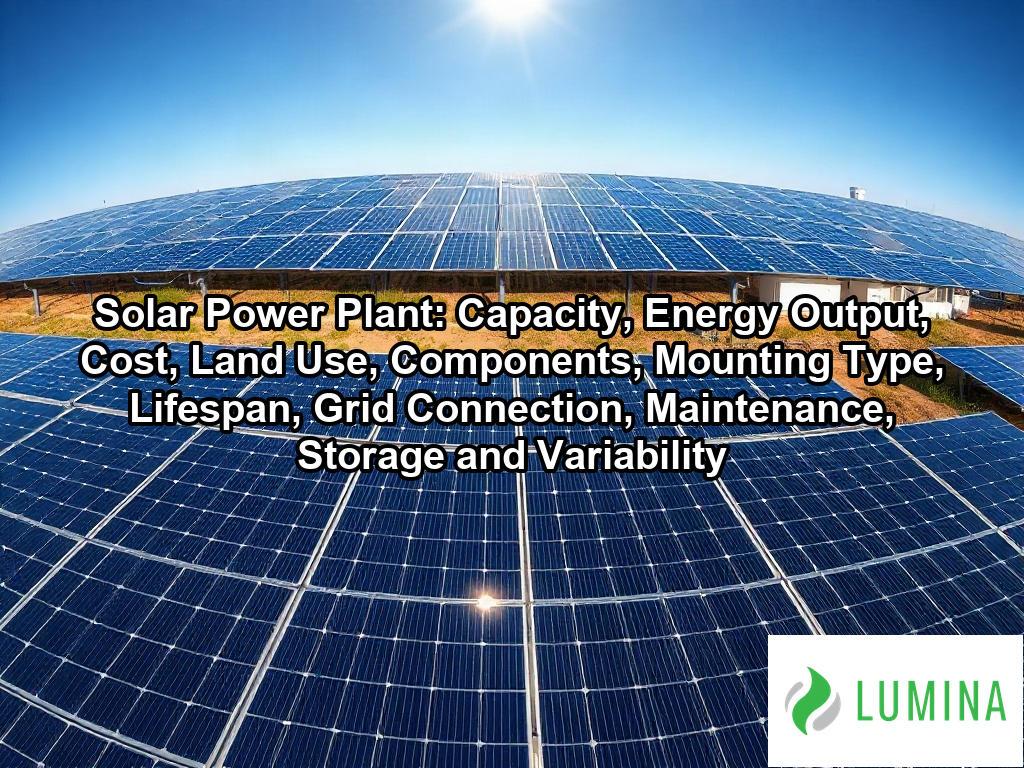
A solar power plant is a facility that converts sunlight into electricity using large arrays of photovoltaic panels or mirrors. Key aspects include capacity, energy output, cost, land use, components, mounting type, lifespan, grid connection, maintenance, and storage and variability. You can think of the facility as a chain that starts with panels, moves current through inverters and transformers, and ends at the power grid. Within the field of solar panels, it is the utility-scale application, where thousands of modules work together instead of a few on a single roof. Information about solar power companies in PA often reflects how such plants are sized, built and connected to regional transmission lines. This article goes on to explain capacity, energy output, land use, cost and the main components, so you can understand how each factor shapes a plant.
Key Takeaways
- A typical solar power plant ranges from 5 MW AC up to 500 MW or more.
- You can expect a 100 MW plant to yield 220,000–250,000 MWh of electricity per year.
- Installing a utility-scale PV system costs roughly $1.00–$1.60 per watt DC.
- Utility-scale PV requires approximately 5–10 acres of land per MW AC.
- Single-axis trackers increase output by about 15–25% over fixed-tilt racking.
How Big Is a Typical Solar Power Plant in MW Compared to Community Solar and Commercial Rooftop Arrays?
A typical solar power plant spans from 5 MW AC to 500 MW AC or more, significantly exceeding the capacity of both community solar projects and commercial rooftop arrays. The Solar Energy Industries Association reports that utility-scale solar projects generally start at 5 MW in capacity and can scale up to hundreds of megawatts to supply the regional power grid. While a solar power plant is designed for large-scale energy production to supply the regional power grid, other solar applications serve smaller, localized needs with distinct physical footprints and generation targets.
Typical Solar Capacity (MW)
| System Type | Typical Capacity Range | Primary Deployment |
|---|---|---|
| Commercial/Industrial Rooftop | Tens of kW to several MW | On-site business demand |
| Community Solar | 0.5 MW to 5 MW | Local grid-tied subscription |
| Solar Power Plant | 5 MW to 500+ MW | Utility-scale transmission |
Understanding these scale differences is essential because the regulatory requirements and interconnection study processes scale exponentially as you move from private rooftop arrays to a multi-megawatt solar power plant. When planning your investment, compare the specific capacity targets of your project against these standardized brackets to determine the appropriate permitting pathway and land acquisition requirements.
Key considerations for project development transition include:- Infrastructure complexity increases, requiring high-voltage substations and specialized transmission line integration for utility-scale projects.
- Environmental mitigation strategies and land-use permitting become more rigorous as project footprints expand beyond commercial rooftops.
- Financial modeling shifts from individual energy cost savings to complex wholesale power purchase agreements and grid-stabilization revenue streams.
- Interconnection queue wait times often increase significantly due to the necessity for comprehensive regional grid impact studies.
How Much Does It Cost to Build a Solar Power Plant per Watt and per MWh?
You can expect the installed cost of a utility-scale solar power plant to range from $1.00–$1.60 per watt DC, resulting in a levelized cost of energy of $30–$60 per MWh before accounting for incentives.
| Project Economic Metric | Unit of Measure | Industry Standard Range |
|---|---|---|
| Installed Capital Expenditure | USD per Watt DC | $1.00 – $1.60 |
| Levelized Cost of Energy (LCOE) | USD per MWh | $30 – $60 |
| Expected Capacity Factor | Percentage (%) | 24% – 28% |
| Operational Lifespan | Years | 25 – 35 |
Utility-Scale Solar Metrics
Installed Cost per Watt DC
The installed cost of a utility-scale solar power plant typically ranges from $1.00 to $1.60 per watt DC. This capital expenditure covers the entire lifecycle of construction, encompassing the procurement of PV modules, inverters, and mounting systems, as well as land preparation and labor. Because utility-scale projects benefit from economies of scale, you will find that these bulk installations are significantly more cost-effective per watt than smaller residential or commercial arrays.
What Drives the Levelized Cost of Energy per MWh?
The levelized cost of energy for a solar power plant is approximately $30–$60 per MWh before incentives. The U.S. Energy Information Administration reports that the levelized cost of electricity for new utility-scale solar photovoltaic plants in the United States generally ranges between $30 and $50 per megawatt-hour, excluding tax credits and subsidies. This metric represents the average net present cost of electricity generation over the plant’s 25–35 year lifespan. Several technical and operational factors dictate this value:
- Capital expenditures: Total equipment and construction costs.
- Capacity factor: The efficiency of energy production, typically 24–28%.
- Performance ratio: System losses due to wiring, soiling, and inverter efficiency, generally 80–90%.
- Output optimization: Utilizing single-axis trackers to increase yield by 15–25% compared to fixed-tilt racking.
Operating and Maintenance Cost per kW per Year
Ongoing expenses are critical to maintaining financial performance throughout the project duration. You should expect an operating and maintenance cost of $15–$25 per kW per year. This covers routine cleaning of PV modules, vegetation management, and the periodic replacement of inverters, which typically reach their end-of-life after 10–15 years.
Effect of Battery Storage on Total Project Cost
Integrating battery storage into a solar power plant significantly increases the initial project investment while altering the revenue model. While battery systems add a substantial premium to the upfront capital cost, they allow you to shift energy dispatch to peak hours, potentially capturing higher electricity market prices or providing essential grid ancillary services.
Review the expected degradation rate of your chosen PV modules against your long-term energy output projections to ensure the levelized cost remains within your financial targets.
Several critical variables outside of base capital expenditures significantly influence the long-term financial viability of a utility-scale solar project:- Geographic Irradiance: Local solar resource availability directly dictates total annual energy production, impacting the denominator of the LCOE calculation.
- Interconnection Expenses: Proximity to existing high-voltage transmission lines and the complexity of grid-integration infrastructure can cause significant site-specific cost variations.
- Operations and Maintenance (O&M): Ongoing costs for panel cleaning, vegetation management, and inverter servicing affect the net energy yield over the project’s 25 to 35-year lifespan.
- Financing Structure: The cost of debt and equity, coupled with project-specific tax equity arrangements, alters the final internal rate of return for stakeholders.
Main Components of a Solar Power Plant, from PV Modules to the Substation
The main components of a solar power plant form a high-voltage assembly that integrates raw photovoltaic capture with grid-ready transmission infrastructure. This equipment architecture moves energy from individual cell-level generation to the final point of interconnection at the substation.
| Component Category | Operational Metric | Standard Performance Range | Technical Function |
|---|---|---|---|
| Photovoltaic Modules | Unit Power Rating | 400–600 W | DC current generation via solar exposure |
| Mounting & Tracking | Efficiency Gain | 15–25% | Array orientation to maximize irradiance |
| Inversion Hardware | DC:AC Sizing Ratio | 1.2–1.4 | Conversion to grid-compatible 60 Hz AC |
Solar Power Plant Component Numeric Ranges (Max Value Normalized)
- PV Modules: The primary building blocks, typically 400–600 W each, which generate direct current (DC) when exposed to sunlight.
- Mounting Structures: The framework that secures the array; this includes fixed-tilt racking or single-axis trackers that rotate to follow the sun and boost output by about 15–25%. Per National Renewable Energy Laboratory, balance of system components in solar power plants generally include these mounting structures along with the electrical wiring, disconnects, and overcurrent protection devices essential for safely transmitting power to the substation.
- DC Collection System: Cables and combiner boxes that gather DC current from the modules and route it toward the power conversion hardware.
- Inverters: The critical devices that convert variable DC power into stable, grid-compatible 60 Hz alternating current (AC), often utilizing a DC-to-AC ratio of 1.2–1.4 to optimize energy delivery.
- Transformers and Substation: Equipment that steps up the electrical voltage to match the requirements of the local transmission or distribution lines for delivery to the utility grid.
- Monitoring and Metering: Sensor suites that track real-time system performance and ensure energy output meets regulatory and utility requirements.
Evaluate the trade-off between the increased energy yield of single-axis trackers and the higher long-term maintenance needs associated with their mechanical moving parts.
How Much Electricity Does a 100 MW Solar Power Plant Produce per Year?
A 100 MW solar power plant produces between 220,000 and 250,000 MWh of electricity per year. This annual output depends heavily on the local capacity factor; per the US Energy Information Administration, utility-scale solar photovoltaic facilities in the United States typically achieve a net capacity factor ranging between 20 percent and 30 percent depending on geographic location and solar irradiance. Because PV modules generate electricity only when sunlight strikes them, this capacity factor accounts for nighttime hours, seasonal variations, and weather conditions that naturally interrupt the flow of energy.
| Operational Metric | Technical Parameter / Range | Impact on Annual Generation |
|---|---|---|
| System Performance Ratio | 90% Efficiency | Baseline conversion effectiveness |
| Tracking Configuration | 15% to 25% Increase | Gain from single-axis solar orientation |
| Inverter Loading Ratio | 1.2 to 1.4 (DC/AC) | Enhanced production during low-light periods |
| Facility Capacity Factor | 20% to 30% | Geographic and irradiance-based output window |
| Component Degradation | 0.4% to 0.5% Annual | Long-term reduction over 25–35 year lifespan |
Energy Yield Performance Factors
To reach these production targets, developers optimize site design using various technical configurations. The total yearly generation is influenced by the following operational factors:
- Mounting strategy: Utilizing single-axis trackers typically increases energy yield by about 15–25% compared to fixed-tilt racking.
- DC-to-AC ratio: Engineers often apply a ratio of 1.2–1.4, which intentionally installs more PV module capacity than the inverter can process at peak, allowing the solar power plant to maintain higher output during dawn, dusk, and low-light periods.
- Performance degradation: You must account for an expected annual output decrease of approximately 0.4–0.5% as components age over the 25–35 year lifespan of the facility.
- System efficiency: Overall performance ratios generally hover between 80% and 90% after accounting for losses in wiring, transformers, and electrical conversion.
Review the historical irradiance data for your specific site to determine where your project will likely land within the 24–28% capacity factor range.
Developers employ several strategic interventions to maintain and improve the energy output of the facility throughout its lifecycle:- Implement real-time monitoring software to detect and troubleshoot individual string failures immediately.
- Schedule regular panel cleanings in arid regions to mitigate efficiency losses caused by dust and soiling.
- Utilize predictive maintenance algorithms to optimize the scheduling of inverter repairs before total failure occurs.
- Manage vegetation growth around the site perimeter to eliminate shade interference on the lower rows of PV modules.
- Coordinate grid curtailment protocols to ensure the plant remains prepared for rapid response to utility-side demand shifts.
Acres Needed per MW for a Solar Power Plant and Whether Sheep Grazing or Crops Can Share the Land
The land required for a solar power plant typically ranges from 5 to 10 acres per MW (AC), depending on the mounting configuration and technology density. Because these projects often occupy hundreds of acres, developers frequently implement agrivoltaics—the practice of co-locating energy generation with agricultural activities—to maximize land utility and address concerns regarding land displacement. Per the United States Department of Energy, agrivoltaics is an emerging practice where solar development coexists with agricultural production, allowing for the simultaneous generation of electricity and the grazing of sheep or the growth of specific crops beneath panel arrays.
Land Requirement per MW (Acres)
| Land Use Strategy | Compatibility | Operational Impact |
|---|---|---|
| Sheep Grazing | High | Reduces mechanical mowing and vegetation management costs. |
| Crop Cultivation | Moderate | Requires raised mounting structures; limited to shade-tolerant crops. |
| Pollinator Habitats | High | Supports local ecosystems and may improve panel performance through cooling. |
While fixed-tilt racking occupies a smaller footprint, the shift toward single-axis trackers necessitates more extensive land spacing to prevent row-to-row shading, which naturally aligns with the space required for grazing or biodiversity corridors. Integrating these dual-use strategies can improve community relations and assist in obtaining necessary land-use permits.
Verify local zoning ordinances to determine if dual-use criteria, such as specific sheep stocking densities or minimum vegetation heights, are mandated for project approval.
Developers should consider the following site-specific factors when implementing dual-use land strategies:- Evaluate soil quality and drainage capacity to ensure the terrain can support both heavy racking equipment and agricultural vegetation.
- Assess regional solar irradiance levels to determine if shade-tolerant crops can maintain economic viability beneath array structures.
- Coordinate with local agricultural extensions to identify native plant species that minimize water consumption while supporting local biodiversity.
- Review zoning ordinances and state-level renewable energy policies to confirm eligibility for dual-use land tax incentives.
Frequently Asked Questions
Are single-axis trackers worth it compared to fixed-tilt mounting in a solar power plant?
Yes, single-axis trackers are worth it because they provide an output gain of about 15–25% over fixed-tilt racking. While fixed-tilt racking is a simpler mounting option, most new utility-scale projects utilize single-axis trackers to maximize electricity production throughout the day by following the sun from east to west.
How long does a solar power plant last, and when do the inverters need replacing?
A solar power plant typically lasts 25–35 years, while inverters usually require replacement after 10–15 years of operation. During the plant’s lifespan, the PV modules experience a gradual performance degradation of about 0.4–0.5% per year, though many remain under performance warranties for up to 30 years.
What does it cost to operate and maintain a solar power plant each year?
Operating and maintenance costs for a solar power plant run roughly $15–$25 per kW per year. This annual expenditure covers essential site activities including panel cleaning, vegetation control, routine equipment inspections, and the necessary servicing of inverters to ensure the system maintains an overall performance ratio of 80–90%.
How does a solar power plant connect to the grid, and why do interconnection queues take so long?
A solar power plant connects to the grid through a substation that steps up voltage for transmission after an interconnection study confirms feasibility. These studies take significant time because they must evaluate how the variable electricity injection affects grid stability, equipment capacity, and the safe flow of power to customers.
What happens to a solar power plant at night or on cloudy days, and do batteries solve it?
Output from a solar power plant decreases during cloudy conditions and ceases at night, but battery storage effectively solves this by providing 2–4 hours of dispatchable capacity. These batteries allow you to store excess energy generated during peak sunlight hours to smooth out intermittent supply and provide power during the evening.