
Utility Scale Solar: Capacity Factor, Land Use, Size, Cost, Panel Technology, Mounting Types, Revenue Model, Grid Connection, Lifespan, Timeline
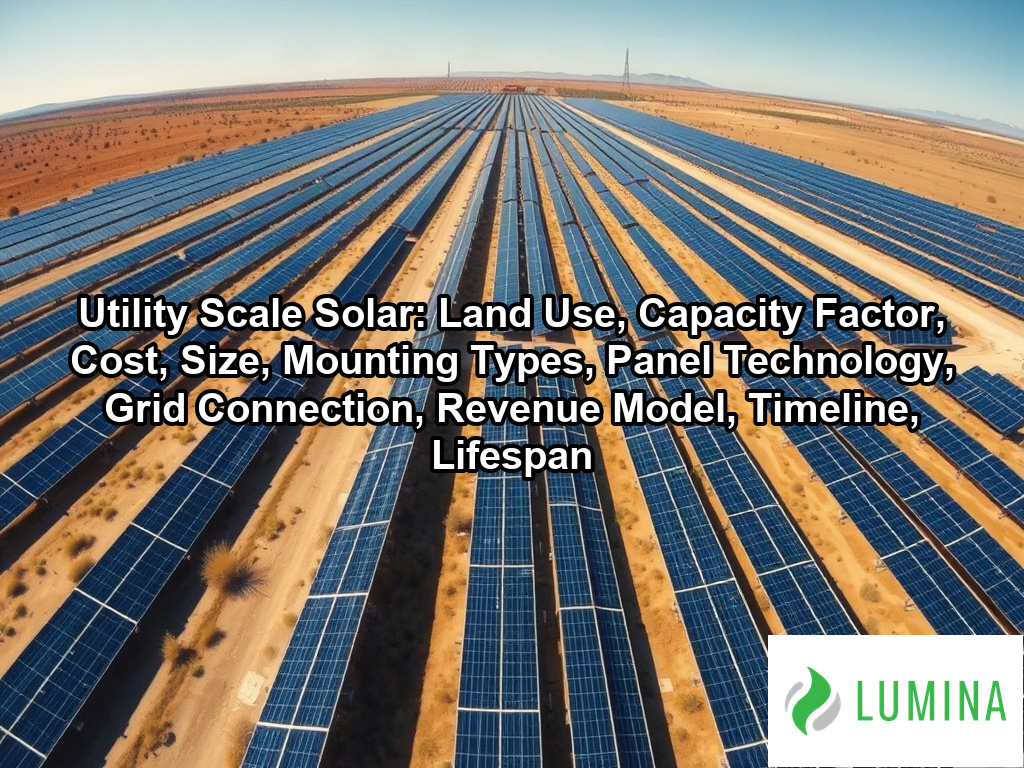
Utility scale solar is a large photovoltaic power plant that feeds electricity into the grid for sale to utilities. Key aspects include land use, capacity factor, cost, size, mounting types, panel technology, grid connection, revenue model, timeline, and lifespan. These plants typically range from a few megawatts to several hundred megawatts, and their panels convert sunlight into direct current that inverters change into grid-ready alternating current. Within the broader field of solar panels, this segment differs from rooftop systems because it relies on large arrays, dedicated substations and long transmission connections. Pennsylvania solar companies operate in a state where farmland, former mine sites and open acreage shape how projects are sited and built. Project size, land use, mounting types, capacity factor and cost are the main topics the article explains, since each one determines how much power a plant delivers and at what price.
Key Takeaways
- Utility-scale solar typically ranges from about 5 MWac to over 700 MWac.
- Land use for utility-scale solar is roughly 5 to 10 acres per MWac.
- Installed cost for utility-scale solar is roughly $1.00 to $1.60 per watt AC.
- The capacity factor for utility-scale solar is 20% to 35% AC.
- The design life of a utility-scale solar plant is 30 to 40 years.
What Size Counts as Utility-Scale Solar, and How Many Homes Does 1 MW Power?
Utility-scale solar counts as a facility capable of generating 1 MWac or more. Per the U.S. Energy Information Administration, a 1 MW solar facility in the United States generates enough electricity to power approximately 170 to 250 typical homes, depending on regional solar irradiance and local average consumption levels. While the lower threshold for these projects is 1 MWac, the industry standard for modern installations is significantly higher, with individual projects frequently scaling to meet the needs of entire municipal grids.
| Project Classification | Capacity (MWac) | Typical Module Quantity | Operational Characteristic |
|---|---|---|---|
| Small Scale Utility | 1 MWac | ~2,000 – 3,000 | Baseline commercial/municipal threshold |
| Standard Modern Utility | 700 MWac | 1,050,000 – 1,750,000 | Large-scale grid supply |
| Storage-Integrated Site | 1,000+ MWac | 1,500,000+ | High-density dispatchable power |
Utility-Scale Solar Project Capacity (MWac)
When you evaluate the scale of these developments, consider how the following factors influence the operational capacity of a site:
- Project Range: Modern developments typically span from about 5 MWac to over 700 MWac.
- Storage Integration: When paired with battery storage systems, the largest single-site projects can exceed 1,000 MWac.
- Oversizing Strategy: Developers commonly utilize a DC-to-AC ratio of 1.2 to 1.4, which ensures the inverters operate at maximum efficiency even when sunlight is suboptimal.
- Module Density: A 100 MWac plant generally requires between 150,000 and 250,000 solar modules to reach its rated output.
Compare your projected energy requirements against the local interconnection queue capacity to determine the maximum viable size for a site in your specific region.
Developers utilize specific design strategies to optimize the effective output and reliability of solar installations:- DC-to-AC Ratio: Engineers intentionally install more DC solar module capacity than the inverter’s AC rating to ensure maximum power output during low-light conditions.
- Tracking Technology: Single-axis trackers are employed to rotate modules throughout the day, increasing total energy yield by up to 25% compared to fixed-tilt systems.
- Bifacial Utilization: Double-sided modules capture reflected sunlight from the ground, significantly boosting energy production per square meter without increasing the physical footprint.
- Interconnection Limits: The final capacity is often determined by the thermal and load-carrying constraints of the local electrical substation and transmission lines.
How Much Does a Utility-Scale Solar Farm Cost per Watt, and What Is Its Levelized Cost of Energy (LCOE)?
You can expect a utility-scale solar project to cost roughly $1.00 to $1.60 per watt AC, with an unsubsidized levelized cost of energy (LCOE) typically ranging from $30 to $60 per megawatt-hour.
| Financial Metric | Unit | Market Range | Primary Cost Drivers |
|---|---|---|---|
| Installed Capital Expenditure | $/Watt AC | $1.00 – $1.60 | Hardware, Labor, Interconnection |
| Levelized Cost of Energy (LCOE) | $/MWh | $30 – $60 | Module Efficiency, DC-to-AC Ratio |
| Power Purchase Agreement (PPA) Price | $/MWh | $35 – $65 | Geographic Location, Solar Irradiance |
Utility-Scale Solar Cost Metrics (USD)
Installed Cost per Watt AC
The installed cost for utility-scale solar projects ranges from roughly $1.00 to $1.60 per watt AC. This figure encompasses the total capital expenditure required to bring a project online, including hardware, labor, land acquisition, and interconnection infrastructure. Because these installations benefit from massive economies of scale and direct sourcing, their cost per watt is significantly lower than that of smaller residential or commercial rooftop systems.
What Drives Levelized Cost of Energy (LCOE) and Power Purchase Agreement (PPA) Prices?
The unsubsidized levelized cost of energy for utility-scale solar is about $30 to $60 per megawatt-hour, while power purchase agreement (PPA) prices are often $35 to $65 per megawatt-hour. Per the United States Energy Information Administration, the levelized cost of energy for new utility-scale solar projects in the United States remains among the most competitive of all dispatchable generation sources, typically ranging between $30 and $50 per megawatt-hour. Several primary factors influence these financial metrics:
- Solar module efficiency and bifacial gain
- Inverter technology and DC-to-AC ratio optimization
- Site-specific sunlight availability and geographic location
- Operations and maintenance costs, typically $10 to $20 per kilowatt-year
Why Unsubsidized LCOE Differs From PPA Pricing
While the LCOE reflects the long-term cost to build and operate a plant, the PPA price is a market-driven rate negotiated between the project developer and the off-taker. The PPA accounts for localized risk, debt financing terms, tax incentives, and the specific profile of the electricity delivered to the grid at a particular point in time.
Development Timeline and Design Life Effects on Cost
The design life of a utility-scale plant spans 30 to 40 years, which amortizes the initial investment over several decades. Developers must navigate a complex development timeline of about 3 to 7 years before construction begins, with the physical build-out taking 6 to 18 months. Because inverters often require replacement once around years 10 to 15, accounting for these periodic capital replacements is essential for accurate long-term financial modeling. Verify the anticipated inverter replacement schedule in your financial model to avoid underestimating mid-life operation expenses.
Several external factors beyond technical hardware costs significantly influence the final financial viability of a utility-scale solar development:- Interconnection Queue Delays: Extended wait times for grid impact studies and transmission upgrades can increase carrying costs and delay revenue generation.
- Financing Costs: Interest rate fluctuations directly impact debt service coverage ratios and the overall weighted average cost of capital (WACC).
- Permitting and Regulatory Hurdles: Costs associated with environmental impact assessments, local zoning hearings, and land-use litigation can vary significantly by state.
- Operation and Maintenance (O&M) Strategy: Automated monitoring, robotic module cleaning, and preventative maintenance schedules dictate long-term performance and O&M expenditure.
- Tax Credit Monetization: The ability to effectively leverage Investment Tax Credits (ITC) or Production Tax Credits (PTC) through tax equity partnerships is critical to reducing the net project cost.
How Many Acres Does Utility-Scale Solar Need per MWac?
Utility-scale solar requires roughly 5 to 10 acres of land per MWac to accommodate the necessary modules, racking, and balance-of-system infrastructure. Per the National Renewable Energy Laboratory, utility-scale solar photovoltaic projects in the United States typically require between 5 and 10 acres of land per megawatt of alternating current capacity depending on panel efficiency and racking configurations. Because site conditions vary significantly, the physical footprint of your utility-scale solar project depends largely on local topography, the spacing requirements of the chosen racking technology, and the specific module efficiency. While denser configurations can minimize land usage, you must balance this against the risk of inter-row shading, which degrades the performance of your solar module array throughout the day.
| System Configuration Factor | Impact on Land Efficiency | Primary Land Constraint |
|---|---|---|
| Fixed-Tilt Racking | High (Tighter spacing) | Panel density |
| Single-Axis Tracking | Moderate (Requires spacing) | Inter-row shading |
| Topography & Setbacks | Low (Increases footprint) | Environmental buffers |
| Service Infrastructure | Low (Increases footprint) | O&M access roads |
| Module Efficiency | High (Higher output density) | Physical array area |
Land Requirements (Acres per MWac)
The total land area is influenced by several design factors that dictate how tightly you can pack the equipment while maintaining efficient operations and maintenance access:
- Rack configuration: Fixed-tilt ground mount systems often allow for tighter row spacing compared to single-axis tracking systems.
- Topography and setbacks: Sloped land or mandatory local environmental buffers frequently increase the total property footprint beyond the active array area.
- Access paths: You must reserve space for interior service roads to facilitate the periodic maintenance of inverters, transformers, and the clearing of vegetation.
- DC-to-AC ratio: Oversizing the DC capacity relative to the inverter rating requires more modules, which directly increases the total acreage footprint.
Review the civil survey of your potential site to determine how much usable, non-shaded land remains after accounting for local regulatory setbacks and internal service pathways.
Several non-physical factors often dictate the total land area required for project development beyond the array footprint itself:- Interconnection Facilities: Substations, switchyards, and gen-tie lines may require dedicated acreage outside the primary solar array.
- Regulatory Setbacks: Local zoning ordinances often mandate specific distances from property lines, wetlands, or public roadways that increase the total site area.
- Stormwater Management: Regional drainage requirements may necessitate the construction of detention basins and bioswales that utilize significant land area.
- Agricultural Mitigation: Some jurisdictions require additional land set-asides or dual-use configurations to preserve soil quality or comply with agricultural protection acts.
Single-Axis Tracking vs. Fixed-Tilt Ground Mount: Which Suits Utility-Scale Solar Better?
Single-axis tracking is better suited for most utility-scale solar projects than fixed-tilt ground mount because it significantly enhances energy capture throughout the day. While fixed-tilt ground mount systems keep solar modules stationary, single-axis tracking technology rotates the arrays to follow the sun’s path from east to west, which increases annual energy production by roughly 15 to 25% compared to static counterparts. Although tracking systems involve higher initial capital expenditures and increased mechanical maintenance due to their moving parts, the substantial boost in electricity output often provides a superior return on investment for large installations. Per Lawrence Berkeley National Laboratory, the increased energy yield from these tracking systems generally offsets the higher capital and maintenance costs in utility-scale projects provided that the site allows for enough space to prevent inter-row shading.
| Performance Metric | Fixed-Tilt Ground Mount | Single-Axis Tracking |
|---|---|---|
| Annual Energy Production | Baseline Reference | 15% to 25% Increase |
| Mechanical Complexity | Zero moving parts | Motors, bearings, and drive systems |
| Terrain Tolerance | High (accommodates slopes) | Low (requires flat, uniform land) |
| Maintenance Frequency | Minimal | Periodic servicing required |
| Capital Expenditure | Lower | Higher |
Annual Energy Yield Increase (Single-Axis vs Fixed-Tilt)
- Energy Yield: Single-axis tracking provides a 15 to 25% increase in annual generation, whereas fixed-tilt ground mount prioritizes simplicity and lower upfront costs.
- Maintenance Requirements: Fixed-tilt ground mount systems have no moving parts, resulting in lower operations and maintenance costs, while single-axis tracking requires periodic servicing of motors, bearings, and drive systems.
- Land Suitability: Fixed-tilt ground mount performs more reliably on complex or sloped terrain, whereas single-axis tracking is most effective on flatter sites that allow for long, contiguous rows.
- Market Prevalence: Single-axis tracking is the dominant choice for new utility-scale solar builds, accounting for approximately 80% or more of current capacity.
Evaluate the specific topographical constraints of your site to determine if the additional energy yield of tracking justifies the increased mechanical complexity and site preparation costs.
Several environmental and site-specific factors influence the viability of selecting single-axis tracking systems for utility-scale solar projects:- Wind load engineering must be more robust to account for the dynamic forces acting on rotating tracker structures.
- Geotechnical requirements are stricter, often necessitating deeper pile driving to ensure structural stability for moving arrays.
- Site design must incorporate sophisticated backtracking algorithms to minimize self-shading during sunrise and sunset.
- Automation and SCADA integration are mandatory for monitoring the status of individual drive motors across the array.
- The project timeline may be extended due to the specialized logistics and longer installation time required for mechanical assemblies.
Capacity Factor of a Utility-Scale Solar Plant and Why It Falls Below Nameplate Capacity
The capacity factor of a utility-scale solar plant typically ranges from 20% to 35% AC, which represents the actual energy delivered to the grid compared to the theoretical maximum output if the plant operated at its nameplate capacity for every hour of the year. Per the Energy Information Administration, utility-scale solar capacity factors generally fall between 20% and 30% because panels only generate electricity during daylight hours and intensity varies by cloud cover and season. This metric falls below the nameplate rating primarily because utility-scale solar is an intermittent resource dependent on daylight, weather conditions, and the sun’s angle relative to the panels. While a plant might be rated at 100 MWac, it cannot generate at that level through the night or during periods of heavy cloud cover, and even under optimal conditions, environmental losses occur.
| Capacity Metric | Percentage Range | Primary Operational Impact |
|---|---|---|
| EIA Conservative Estimate | 20% | Base-level expectation accounting for seasonal variance |
| Typical High Performance | 30% | Optimal daylight generation under favorable weather |
| Theoretical Maximum Capacity | 100% | Baseline nameplate rating (never achieved annually) |
| Note: Realized output is constrained by diurnal cycles, clipping losses, and equipment degradation. | ||
Utility-Scale Solar Capacity Factors
Several specific technical and environmental variables constrain the total energy production of these facilities:
- Diurnal Cycle: The physical absence of sunlight during nighttime hours immediately sets a maximum possible capacity factor regardless of equipment efficiency.
- DC-to-AC Ratio: Operators intentionally oversize the DC array relative to the inverter capacity—usually at a DC-to-AC ratio of 1.2 to 1.4—to maximize output during low-light periods, which causes the system to clip at its nameplate limit during peak irradiance.
- Degradation and Maintenance: Over a design life of 30 to 40 years, modules lose 0.4% to 0.7% of their output efficiency annually, and scheduled downtime for inverter service or module cleaning reduces the total operational time.
- Environmental Losses: Soiling from dust, high temperatures that decrease semiconductor efficiency, and wiring impedance all subtract from the potential energy yield.
Evaluate your expected site-specific solar resource data against these inherent losses to confirm the project’s financial viability based on realistic seasonal generation profiles.
Several technical factors beyond environmental conditions influence the realized capacity factor of utility-scale solar installations:- Inverter efficiency and clipping losses occur when DC array output exceeds the maximum AC power rating of the inverters.
- Soiling from dust, pollen, or snow accumulation reduces light absorption across the panel surface.
- Voltage drop and resistive heating within the balance of system components lead to energy dissipation before grid injection.
- Periodic curtailment protocols mandated by grid operators may force plants to reduce output despite available solar irradiance.
Frequently Asked Questions
What type of solar panels are used in utility scale solar plants, and are bifacial modules worth it?
Utility scale solar plants primarily use monocrystalline silicon solar modules rated at 400 to 700 watts, along with thin-film cadmium telluride modules. Yes, bifacial modules are worth it because they capture rear-side light, adding roughly 5 to 15% to your total energy output compared to standard, single-sided modules.
How does electricity travel from utility scale solar panels to the grid, and what does a DC-to-AC ratio mean?
Electricity travels from solar modules through string combiner boxes to an inverter, which converts DC to AC before passing through a substation to the grid. A DC-to-AC ratio of 1.2 to 1.4 means you have installed 20% to 40% more DC-rated capacity than the total inverter AC capacity.
How do utility scale solar projects make money through power purchase agreements or wholesale markets?
Utility scale solar projects generate revenue by securing long-term power purchase agreement (PPA) contracts with utilities or corporations, often priced at $35 to $65 per MWh. Alternatively, developers earn income by selling electricity directly into wholesale markets, depending on local demand and the specific project strategy and location.
How long does it take to develop and build a utility scale solar project, and why do interconnection queues delay it?
Developing a project takes about 3 to 7 years, with actual construction lasting 6 to 18 months. Interconnection queues cause the longest delays because they involve complex and uncertain technical studies required to ensure that connecting your new power source will not compromise the stability of the existing grid infrastructure.
How long do utility scale solar plants last, and what happens to the panels at end of life?
Utility scale solar plants have a design life of 30 to 40 years, during which your solar module output degrades by about 0.4 to 0.7% annually. At the end of this life cycle, equipment is typically decommissioned, and the materials are processed through recycling streams to reclaim valuable components.