
Solar Farms: Power Output, Land Use, Size, Build Cost, Lifespan, Types, Limitations, Components
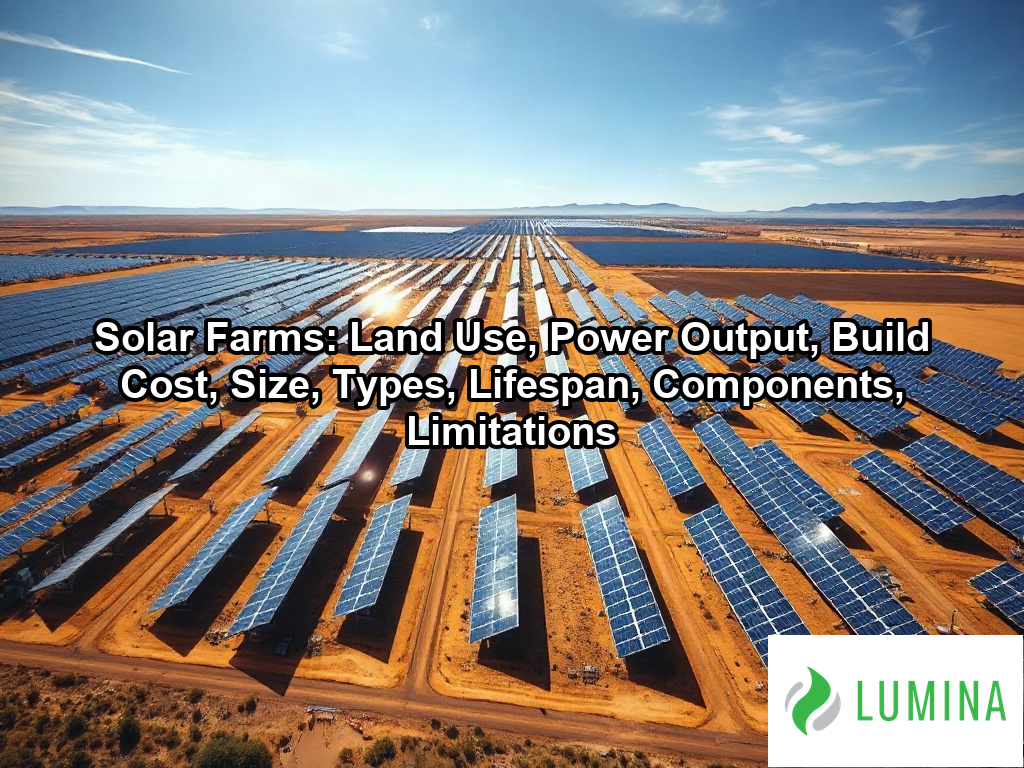
Solar farms are large ground-mounted arrays of photovoltaic panels that generate electricity for the power grid. Key aspects include land use, power output, build cost, size, types, lifespan, components, and limitations. Solar farms work by converting sunlight into direct current in panel arrays, then passing it through inverters and transformers that match grid voltage. Within the wider field of solar panels, they represent the utility-scale end of the market, in contrast to rooftop systems on individual buildings. Projects developed by PA solar companies often sit on farmland, former industrial sites, or reclaimed mining land across Pennsylvania. This article explains how much land a project occupies, how sizes and types differ, what power output you can expect from a given capacity, and what drives build cost.
Key Takeaways
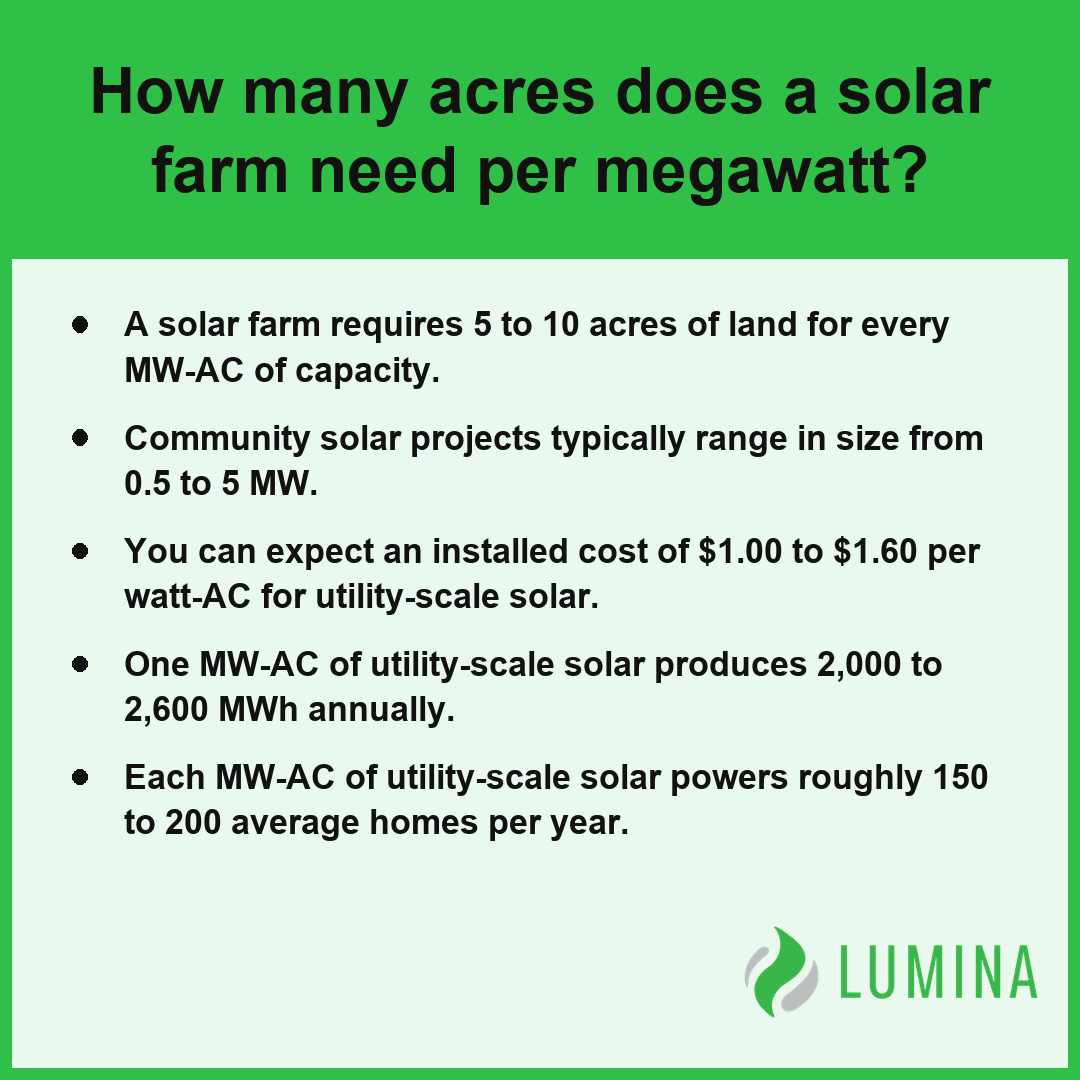
- A solar farm requires 5 to 10 acres of land for every MW-AC of capacity.
- Community solar projects typically range in size from 0.5 to 5 MW.
- You can expect an installed cost of $1.00 to $1.60 per watt-AC for utility-scale solar.
- One MW-AC of utility-scale solar produces 2,000 to 2,600 MWh annually.
- Each MW-AC of utility-scale solar powers roughly 150 to 200 average homes per year.
How Many Acres Does a Solar Farm Need per Megawatt?
A solar farm typically requires 5 to 10 acres of land per MW-AC to accommodate the necessary equipment and maintain safe operational buffers. Per the U.S. Department of Energy, land requirements for solar farms generally range from 5 to 10 acres per megawatt depending on the specific technology, panel efficiency, and site geography. This land footprint ensures that rows of photovoltaic (PV) modules are spaced adequately to prevent self-shading, while also allowing sufficient access for the installation of inverters, medium-voltage transformers, and the internal site roadways required for long-term maintenance.
| Project Factor | Impact on Land Density | Acreage Requirement Trend |
|---|---|---|
| Single-Axis Tracking | Requires wider row spacing to mitigate self-shading | Increases land use |
| Irregular Topography | Limits array density due to terrain constraints | Increases land use |
| DC-to-AC Ratio (High) | Increases number of PV modules per inverter | Increases land use |
| Non-Generating Infrastructure | Allocates space for substations, fencing, and drainage | Increases land use |
| High-Efficiency Modules | Maximizes power output within a smaller footprint | Decreases land use |
Land Requirement per MW-AC (Acres)
Several technical factors influence why utility-scale solar projects occupy this specific range of land density:
- Racking Configuration: Using a single-axis tracker increases ground coverage density because the panels tilt throughout the day, necessitating wider row spacing to avoid shadows cast by adjacent rows.
- Site Topography: Irregular terrain or protected environmental zones within a parcel often force a less efficient layout, pushing the project toward the higher end of the acreage requirement.
- System Components: Space must be reserved for non-generating infrastructure, including the substation for grid interconnection, perimeter fencing, and stormwater management systems.
- DC-to-AC Ratio: Higher inverter loading ratios (up to 1.4) require more PV modules on the ground to feed the inverters, which can slightly increase the total land needed to reach a specific MW-AC capacity.
Review the site’s topography maps and environmental constraints to determine if your potential land area will support the standard acreage requirements for your target capacity.
Several additional considerations influence land usage beyond the primary technical project factors.- Setback Requirements: Local zoning ordinances often mandate specific distances between solar equipment and property lines, public roads, or residential dwellings, which can significantly expand the total project area.
- Environmental Mitigation: Projects may require additional land set-asides to protect protected wetlands, cultural heritage sites, or native habitats identified during the permitting phase.
- Interconnection Facilities: The proximity of the project to existing utility substations dictates the length of the gen-tie line and the amount of land needed for switchyards.
- Soil Stability and Remediation: Sites with poor soil quality or contamination may require specific ground-mount foundation designs or containment areas that affect overall usable acreage.
- Operational Buffers: Security fencing, vegetation screening, and fire safety access paths are mandatory requirements that consume land outside the active generation footprint.
Solar Farm Size: Community Solar vs. Utility-Scale Solar
Solar farm size is determined primarily by the intended output scale and the distribution model, which differentiates community solar from utility-scale solar projects. While both utilize photovoltaic (PV) modules and grid-connected infrastructure, they serve distinct operational roles.
Solar Project Capacity Range (MW-AC)
| Feature | Community Solar | Utility-Scale Solar |
|---|---|---|
| Project Capacity | 0.5 to 5 MW-AC | 1 MW-AC to 1,000+ MW-AC |
| Distribution Model | Subscriber bill credits | Power purchase agreement (PPA) |
| Typical Purpose | Localized energy access | Bulk grid supply |
Community solar focuses on providing renewable access to residential or commercial subscribers who cannot install panels on their own properties. According to the Department of Energy, utility-scale projects typically exceed 5 megawatts to serve the bulk power grid, while community solar installations generally stay between 0.5 and 5 megawatts to facilitate local subscriber bill credits. These solar farms are inherently smaller to remain compatible with local distribution grids. Conversely, utility-scale solar prioritizes high-volume generation, often requiring massive land tracts to meet the requirements of large-scale power purchase agreement (PPA) contracts. When evaluating a project’s footprint, compare the capacity requirements of the interconnection point against the local land availability to determine which classification best fits your objective.
Consider these factors when evaluating the feasibility of a potential solar site:- Assess local zoning ordinances and land-use restrictions to determine if the site permits energy infrastructure.
- Analyze the proximity to existing three-phase distribution lines to estimate interconnection costs.
- Evaluate the soil stability and geotechnical conditions for racking system installation requirements.
- Verify the availability of local load demand to ensure the project aligns with utility capacity limits.
- Calculate environmental compliance requirements, including potential impact studies for local wildlife or historical sites.
What Are the Different Types of Solar Farms?
You can categorize a solar farm as either utility-scale solar, which typically uses 5 to 10 acres per MW-AC to provide power to the regional grid, or community solar, which generally features a size of 0.5 to 5 MW to allow you to subscribe to a shared system of photovoltaic (PV) modules. According to the National Renewable Energy Laboratory, community solar farms allow multiple residential or commercial subscribers to receive credits on their utility bills for the energy produced by a shared off-site solar array.
| System Configuration | Mechanical Complexity | Typical Application | Daily Energy Gain vs. Fixed | Maintenance Profile |
|---|---|---|---|---|
| Fixed-Tilt | Low (Static Mount) | Budget-constrained / High-durability | Baseline (0%) | Minimal |
| Single-Axis Tracker | Moderate (Active Rotation) | Utility-Scale Optimization | 15% – 25% | Moderate |
Daily Energy Output Increase (Tracker vs. Fixed-Tilt)
Fixed-Tilt Solar Farms
Fixed-tilt solar farms are installations where photovoltaic (PV) modules are mounted at a static angle and orientation, typically facing south to capture maximum sunlight without moving throughout the day. These systems prioritize simplicity and durability, as they lack the motors and complex control systems required for tracking. While they occupy the same land area as other designs, their steady output profile makes them a reliable choice for projects where environmental conditions or strict budget constraints necessitate a lower-maintenance mechanical design.
Single-Axis Tracker Solar Farms
Single-axis tracker solar farms are the most common utility-scale solar configuration, utilizing systems that rotate PV modules east to west to follow the sun. This movement significantly improves performance compared to static mounting options. You can expect the following technical advantages from this design:
- Increased daily energy output of 15 to 25 percent over fixed-tilt systems.
- Optimized light absorption across the entire arc of the sun.
- Advanced structural designs that allow panels to stow in flat positions during high-wind events.
- Improved capacity factor due to consistent irradiance throughout the operational day.
What Makes Floating Solar Different?
Floating solar farms differ from traditional ground-mounted arrays by installing photovoltaic (PV) modules on buoyant platforms located on bodies of water rather than on land. This configuration is particularly beneficial for managing land use constraints and cooling system components through water evaporation.
Where Floating Solar Works Best
These systems are uniquely suited for placement on man-made reservoirs or industrial ponds where the water surface is calm and largely undisturbed. By covering a portion of the water, these solar farms help minimize evaporation rates, which can be an added environmental benefit for local water management. Assess the wave action and potential water level fluctuations of your intended site to determine if the structural tethering systems can safely accommodate the environmental variance of the basin.
Consider the following additional factors when evaluating the feasibility of a solar farm configuration:- Site Topography: Flat terrain is ideal for single-axis trackers, whereas fixed-tilt systems can more easily adapt to undulating or sloped land.
- Geotechnical Stability: Sites with loose soil or high water tables may require specialized mounting foundations that increase the initial capital expenditure.
- Grid Interconnection Requirements: Proximity to existing high-voltage transmission lines significantly influences the total cost and permitting timeline for utility-scale developments.
- Local Weather Patterns: Regions prone to high-speed winds or heavy snow loads may necessitate reinforced fixed-tilt structures to prevent mechanical failure.
How Much It Costs to Build a Solar Farm per Watt
The costs to build a solar farm per watt typically range from $1.00 to $1.60 per watt-AC for utility-scale solar projects. This figure encompasses the comprehensive capital expenditure required to bring a site online, including the procurement of high-efficiency photovoltaic (PV) modules, racking systems, inverters, and the labor required for construction and site preparation. While the initial capital investment is a significant barrier, the long-term economic viability is often assessed through the levelized cost of energy (LCOE), which for these solar farms sits between $30 and $60 per MWh without federal subsidies.
| Cost Category | Primary Components & Requirements | Impact on Total CapEx |
|---|---|---|
| Equipment Procurement | Photovoltaic (PV) modules, inverters, and solar tracking hardware | Largest share of total project investment |
| Site Preparation & Racking | Land clearing, soil grading, and structural steel pile installation | Significant influence based on site topography and geotechnical needs |
| Electrical Interconnection | Grid linking hardware, transmission upgrades, and utility-specific fees | Variable expense driven by proximity to existing regional power infrastructure |
Utility-Scale Solar LCOE Range ($/MWh)
Several financial and technical variables influence the final price point per watt-AC. Per United States Energy Information Administration, capital costs for solar farm construction are generally influenced by geographic location, labor availability, and the requirement for interconnection infrastructure to the regional power grid. Understanding the breakdown of these investment categories allows you to gauge how specific design choices impact the overall financial profile of the plant:
- Equipment Procurement: Costs for PV modules, trackers, and inverters often constitute the largest share of the budget.
- Site Preparation and Racking: Expenses related to land clearing, grading, and the installation of deep-driven steel piles for structural support.
- Electrical Interconnection: Fees and physical hardware requirements to link the facility to the transmission or distribution grid.
- Operational Planning: Costs allocated to environmental permitting, legal structuring of a power purchase agreement (PPA), and project management.
Factor the impact of the DC-to-AC inverter loading ratio into your budget, as choosing a higher ratio increases initial module procurement costs while simultaneously optimizing the total energy harvest over the project’s lifetime.
Several external factors beyond hardware costs significantly influence the final financial feasibility of utility-scale solar installations:- Regulatory permitting and compliance timelines, which vary by jurisdiction and can extend project development duration.
- Geographic variations in solar irradiance, directly affecting the annual energy yield and the return on investment.
- Financing structures, including interest rates and the availability of tax equity partnerships for renewable energy projects.
- Operations and maintenance (O&M) requirements, such as vegetation management, inverter servicing, and automated panel cleaning cycles.
How Many Homes Can a 1 MW Solar Farm Power in a Year?
A 1 MW-AC solar farm can power roughly 150 to 200 average homes in a year, depending on the specific region and the electricity consumption habits of those households. Per the Solar Energy Industries Association, a one-megawatt solar farm can typically provide enough electricity to power approximately 160 to 200 homes in the United States. Because electricity generation varies based on local irradiance and the specific equipment configuration, the total annual yield for a 1 MW-AC array typically ranges from 2,000 to 2,600 MWh. When evaluating how these solar farms contribute to residential needs, consider the following variables that influence total output:
| Operational Variable | Technical Specification Range | Impact on 1 MW-AC Array Performance |
|---|---|---|
| Capacity Factor | 23% – 30% | Determines annual total energy production yield (MWh) |
| DC-to-AC Inverter Loading Ratio | 1.2 – 1.4 | Maximizes peak generation hours throughout the day |
| Single-Axis Tracking Gain | 15% – 25% | Increases output vs. fixed-tilt; expands residential reach |
| Annual Module Degradation | 0.3% – 0.8% | Reduces long-term power availability over 25–40 year lifespan |
Energy Production Variables (Impact/Efficiency Ranges)
- Capacity Factor: Utility-scale systems generally maintain a capacity factor of 23 to 30 percent, which dictates the total energy production over the course of a year.
- DC-to-AC Ratio: By using an inverter loading ratio of 1.2 to 1.4, the system captures more energy throughout the day, effectively increasing the hours of peak generation.
- Module Degradation: Over the 25 to 40 years that solar farms typically operate, annual panel degradation of 0.3 to 0.8 percent will incrementally reduce the amount of power available to the grid.
- Tracking Technology: The use of a single-axis tracker can boost output by 15 to 25 percent compared to fixed-tilt designs, allowing a single installation to support a greater number of residential units.
Review the historical average monthly electricity consumption for your specific residential target market to determine if the local capacity factor of a planned installation will meet the projected demand.
Several external environmental factors also influence the actual energy delivery and long-term viability of a solar installation:- Soiling Losses: The accumulation of dust, pollen, or snow on panels can reduce efficiency by 2% to 5% annually depending on local precipitation patterns.
- Temperature Coefficient: Higher ambient temperatures can cause voltage drops in photovoltaic cells, typically reducing power output as modules exceed their 25°C standard test temperature.
- Grid Interconnection Limits: Local utility infrastructure capacity may necessitate curtailment, preventing the system from exporting its full potential output during peak production hours.
- Cable and Transformer Losses: Electrical resistance within the array’s internal wiring and power conversion processes typically results in a 2% to 4% energy loss before the electricity reaches the grid.
Frequently Asked Questions
What equipment does a solar farm need to send power to the grid?
A solar farm needs photovoltaic (PV) modules, racking, inverters, combiner boxes, medium-voltage transformers, and a substation to send power to the grid via an interconnection. These components work together to convert direct current from the modules into grid-ready alternating current, which is then sold through a power purchase agreement (PPA).
How long does a solar farm last and how much do panels degrade each year?
A solar farm typically operates for 25 to 40 years, while photovoltaic (PV) modules degrade at a rate of 0.3 to 0.8 percent per year. Manufacturers usually provide 25 to 30 year performance warranties to ensure the facility maintains consistent energy production throughout its functional lifespan.
How much do landowners get paid per acre to lease land for a solar farm?
Specific lease rates for land are not defined by standardized industry figures, as compensation depends on regional market demand, site accessibility, and proximity to electrical infrastructure. Developers generally calculate land requirements based on 5 to 10 acres per MW-AC to ensure sufficient space for utility-scale solar project layouts.
What does it cost each year to operate and maintain a solar farm?
The cost to operate and maintain a solar farm is generally reflected in the unsubsidized levelized cost of energy (LCOE), which is $30 to $60 per MWh. While specific annual maintenance budgets vary by project size, owners typically allocate these funds to manage system performance and ensure long-term equipment reliability.
What are the limitations of solar farms, such as nighttime output and grid interconnection delays?
Limitations of solar farms include a typical capacity factor of 23 to 30 percent due to nighttime inactivity and the technical requirements of the interconnection process. To address energy intermittency, some projects incorporate battery storage or rely on grid balancing to manage the consistent electricity needs of solar farms.